I recently wrote a few words about the cost of job scheduling (The Whipping Boy Approach to Job Scheduling), this is a follow-up to that post. The motivation for this excursion into job scheduling performance was a report that a Unity project I am involved with scales very poorly with an increased number of worker threads. I have since had the time to review some broader profiles from certain consumer platforms, and I have found something to blame outside of the job system (there might still be more to find). In fact, it is quite easy to find at least one of the reasons for a slowdown with the right tools. That’s what we are going to talk about today.
Parallelizing code yields the biggest benefit if you can divide the work to be done into truly independent parts that do not require much interaction between each other. Parallelizing work that is not independent often leads to (potentially drastically) worse performance than even serially processing the work, and it can get much, much worse the more parallelism you throw at it.
For example, I recently covered an example of 32 threads fighting over a bunch of locks in Unity Burst and the kernel theory of video game performance: C# code that was written for one runtime (CoreCLR) is now running on another runtime (Mono), and those two runtimes happen to differ on whether you can independently allocate memory concurrently.
In the context of Unity, the same general problem of contention on allocators can occur in native code. Let me show you how I found that:
As a first step, we took two captures in Unity’s profiler: one with two job worker threads, and one with five job worker threads. You can control the number of job worker threads from the commandline using -job-worker-count 2, for example. In both cases, we chose a representative and easy to reproduce setup of which we then captured 300 frames of gameplay. The next step involves Unity’s Profile Analyzer package. This is a package for deeper analysis and comparison of profiler captures. The only real fault of the Profile Analyzer is that it is written in C# and runs in Unity’s editor, which means that the tool is an order of magnitude or two slower than it should be.
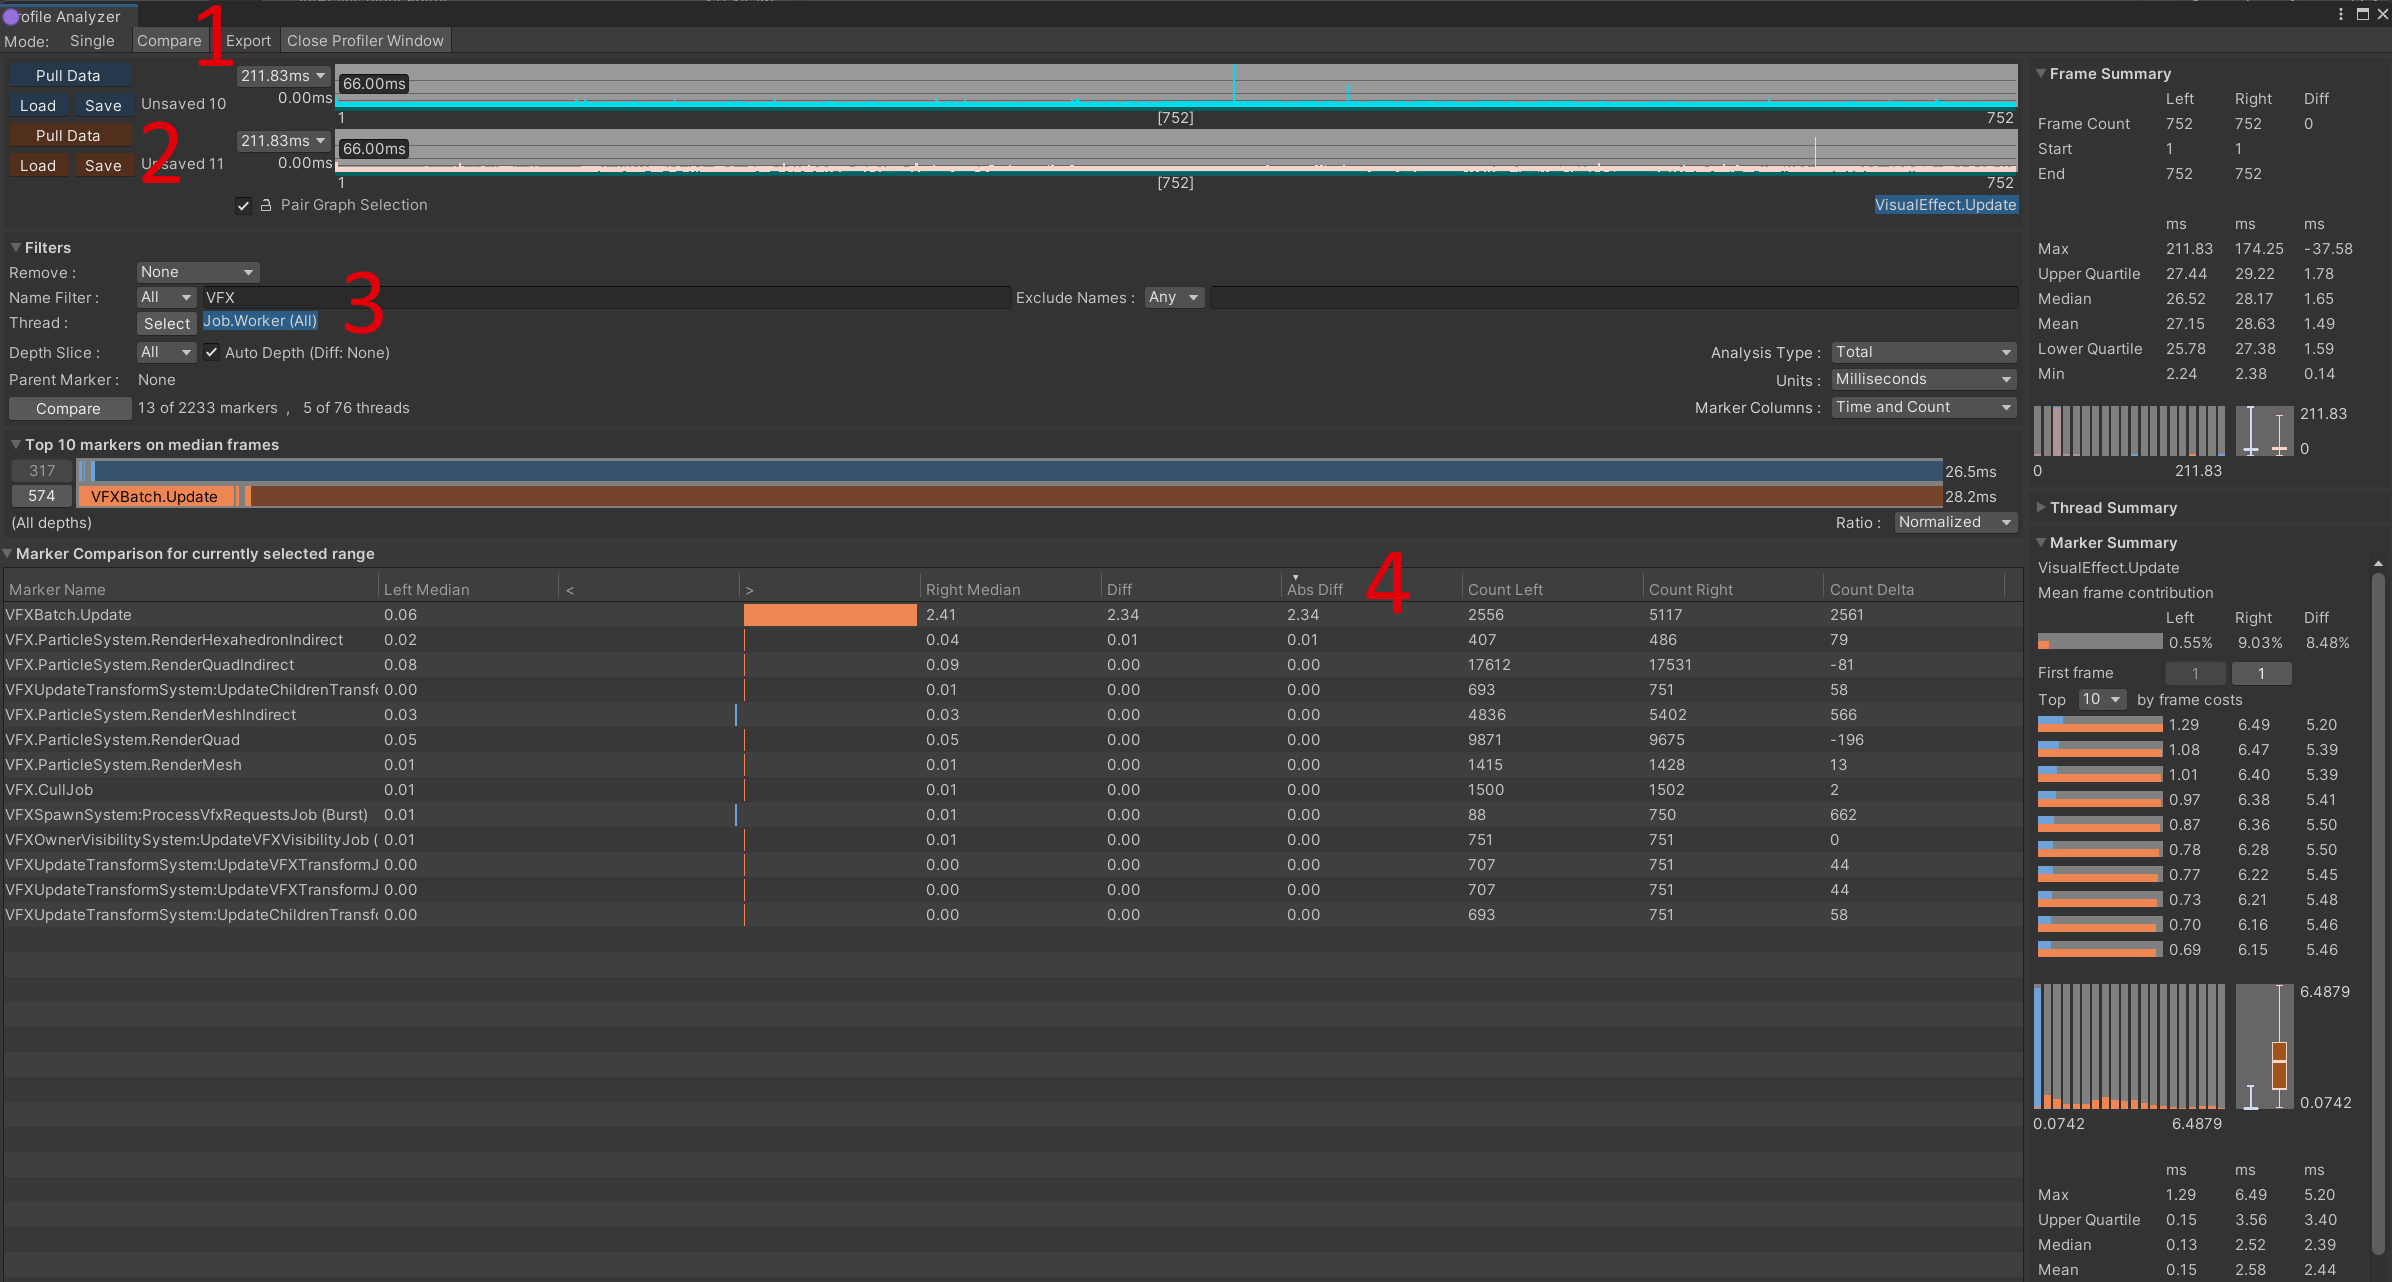
Once you open Profile Analyzer, click the Compare tab (marked below with a red 1). You usually want to have both the profiler window and the Profile Analyzer open, if only because you cannot directly load profiler captures into Profile Analyzer. The save/load buttons (near the red 2) only operate on data that has already been processed in Profile Analyzer. To get your profile capture itself into Profile Analyzer, you have to load the capture in the profiler window itself and then click the Pull Data button. Then repeat this for the second trace and click the Pull Data button of the other color. Once you have pulled data for both captures, you can use Profile Analyzer to compare the two traces in detail. You can set up some filters in the filter section (near the red 3). In this case, I selected only the job worker threads (because I already compared the main thread) and I am filtering profiler markers by the substring VFX (because I already know where this is going).
Finally, in the table at the bottom you can sort the different markers by various criteria: “Absolute Difference in median time” (near the red 4) is the most useful one for this case.

Would you believe it: 2 worker threads take 0.06ms for VFXBatch.Update, while 5 worker threads take 2.41ms per frame. One possible-but-unlikely explanation is that in the case with 2 worker threads the majority of that VFX batch update is happening on the main thread. I have ruled this out by also looking at the main thread: yes, there is some variation, but let’s be generous and say that the 2 worker thread scenario could take 0.2ms instead of 0.06. That still leaves a factor of 10 slowdown for this particular part. This difference is still so shocking that I ended up re-checking everything with another set of two Unity captures.
For the next step, we also prepared two Superluminal captures of the game in the same situation. Superluminal does not have a feature for comparing traces, but once we know where to look it will give us a much better understanding of why it is so slow. To be clear, it should not have been hard to figure out to look at the job worker threads, in which case we would not have needed to take a detour via Profile Analyzer and Unity’s profiler. However, I was very focused on seeing whether something changed on the main thread and ignored some obvious signs (we spent more time waiting on jobs!), so I did not take this detour on purpose. (I also enjoy the opportunity to talk about Profile Analyzer; everybody wins!)
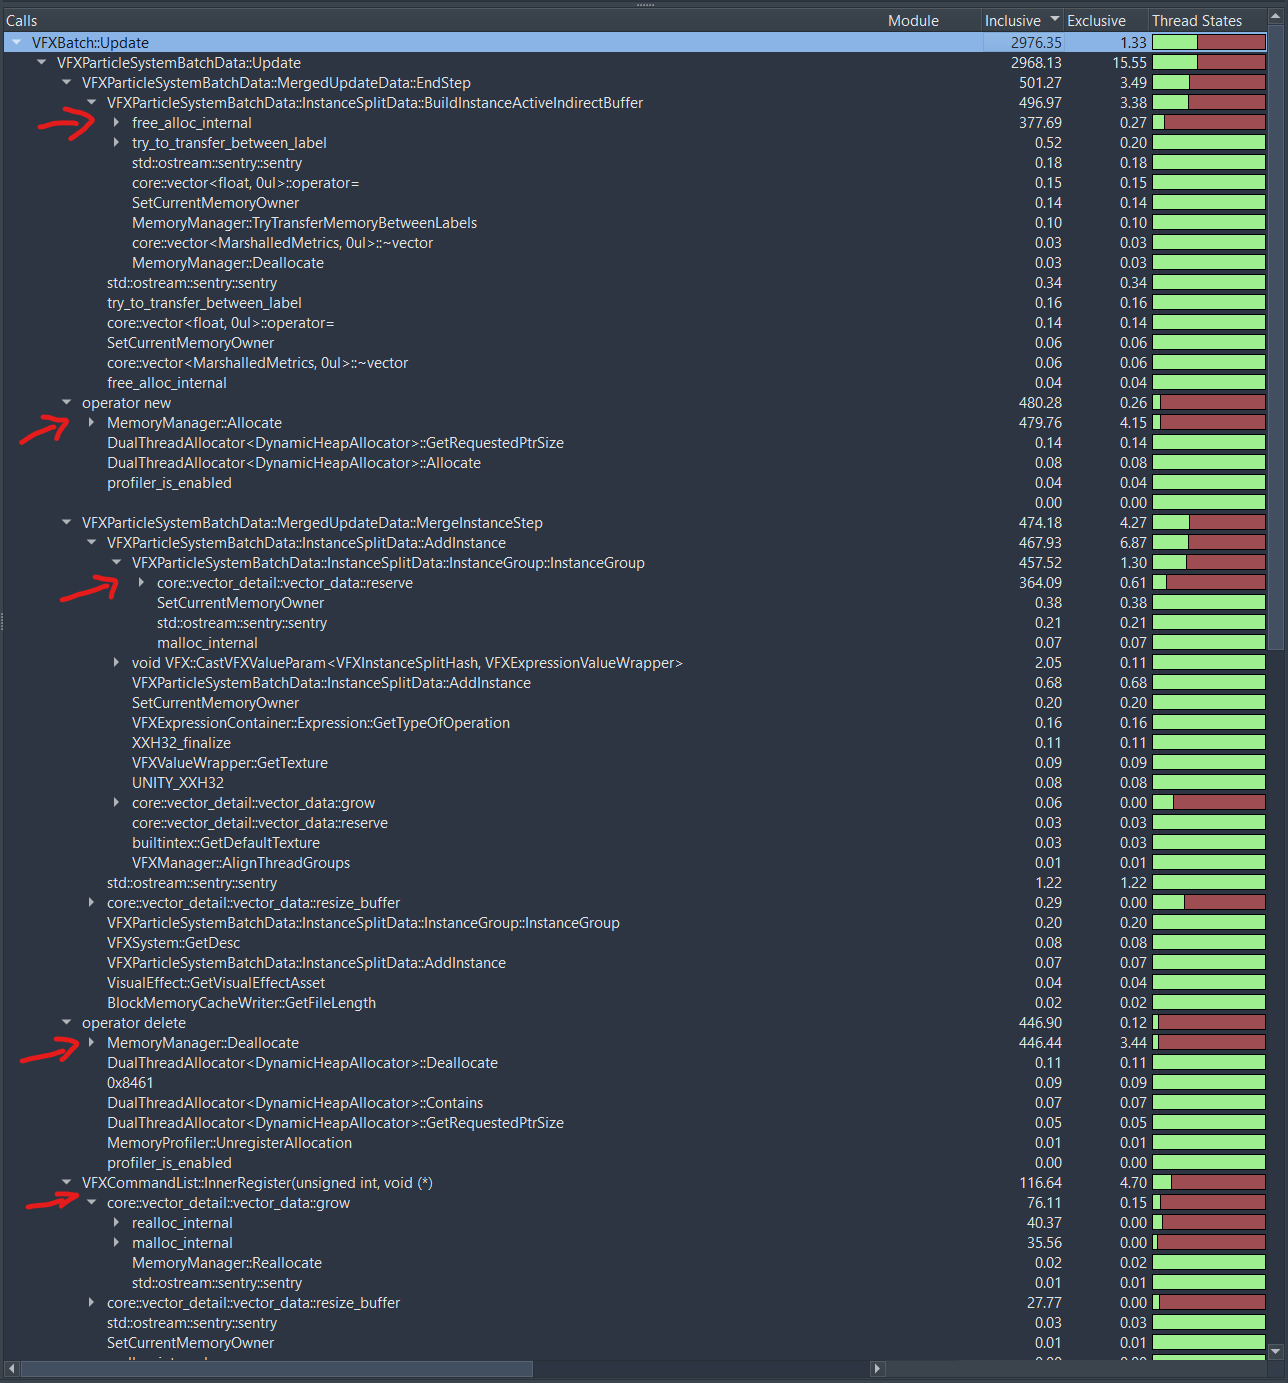
In Superluminal, select all job threads on the left hand side and go to the function list. Then search for VFXBatch. You will find that the 2 thread capture does not really show much about VFXBatch::Update, because we spend so little time there. However, for the 5 worker thread case we find this:

Note the red and green bars on the right-hand side. This is the thread state. We are going to take a brief excursion into thread states now before returning to this.
Superluminal uses a color-coding scheme to give you a high level overview of what a thread is doing at any time:
- Green: Processing. The thread is processing something. It’s doing work! That does not mean that the work it is doing is smart, required, or not a complete waste of time, but you are doing something.
- Red: Synchronization. The thread is blocked. For a worker thread in a thread pool, this could either mean that there is no work for the worker thread, or that the worker thread started something and then blocked on e.g. a lock that it failed to take.
- Dark Blue: I/O. The thread is waiting for an I/O-request to finish.
- Bright Blue: Memory management. This usually means that the OS is busy getting some memory page for you, e.g. you tried to read a file that was already cached (so there is no I/O, but still memory management to do).
- Purple: Sleeping. The thread is explicitly sleeping. Does not show up much.
- Another shade of blue that I can’t really tell apart from the other ones but rarely need to anyway: Preemption. This means you have more threads active and trying to do work on than your system can actually handle, so some of your threads need to stop running to give other threads a chance to have their share of the time.
These colors are not really all that well-explained (or I did not find it?) in Superluminal’s documentation. They depend on the platform that you are profiling and are often just a general guidelines to what is happening (e.g. memory management is a broad category that shows up very often in unexpected places, but regular page faults do not count towards it). In any case, the most important ones to look out for are RED and GREEN. How can you use thread states productively? Take a look at this below:

These are the thread state tracks for two threads as you would see it in the main view. We can immediately spot a pattern: When the upper thread turns red, the lower one turns green. This suggests that the upper thread hands work off to the lower thread and then waits for that work to complete before continuing. You can also see that the lower thread spends a lot of time at 30% green or so, and near the middle the upper thread hovers at around 60% green.
Any area that shows prolonged activity at a level that is somewhere in the middle between red and green is suspicious. This usually indicates that you have a thread that is relatively rapidly switching between “doing work” and “waiting for something.” In the worst case scenario, this is a thread that is constantly trying to take a lock while some other thread does the same – your threads contend over some resource and your work is hence not independent. In the best case scenario, this is something like a worker thread that just waits for work (messages, bytes, a pipe etc.) and does not receive enough input to be constantly busy, but as we have learned in The Whipping Boy Approach to Job Scheduling, this switching can be quite expensive in that case as well and you should probably rethink your approach if you spot this.
Another good proxy for spotting contention and sub-optimal async/parallel work is Superluminal’s thread interaction view and the “thread interaction” arrows that come with it: When your thread is unblocked you can often see who is unblocking it (assuming that the thread that unblocked your thread, e.g. by releasing a lock, is currently in view in Superluminal). For this, you can follow and click the small white arrows in the main timeline view, which will bring you to the Thread Interaction panel. Watch out for periods with many, dense arrows to spot areas where your threads are just getting into each others’ way:

Back to VFXBatch::Update. You can see that a good chunk of the time of the VFX update is red in the thread state on the right, and if you follow the red bars down the calltree you will see the time spent in synchronization is all happening in allocation and deallocation routines, because Unity’s main persistent allocator uses a lock. There are other thread-local allocators, but the main allocator is not one of them.
This is from a custom build of Unity based on 2022.3, so in theory it is possible that this problem does not exist in Unity-proper. However, I have no reason to believe that Unity’s VFX update does not have the same scaling issues.
Finally: Did you notice that the thread state for VFXBatch::Update is only 60% red, yet the difference between two worker threads and five worker threads is much larger than what would be explained by the proportion of time spent in synchronization? While “contending over a lock” is very visibly captured in Superluminal by the red Synchronization thread state, there is also a lot of contention that is not as easily visible (e.g. constantly trying to write to the same cache line across threads). But that is a topic for another time. Maybe I find an example when I fix this VFX update code.