I was recently approached by a friend with a fun performance puzzle that sheds a light on why you should be very careful with microbenchmarks. This puzzle happens in the context of Unity and DOTS, but you can easily follow along without any specific knowledge of that.
With DOTS, you use an LLVM-based native compiler (Burst) to generate optimized machine code for a subset of C#. Unity’s Entities package offers an implementation of the Entity-Component-System paradigm. Entities live in “chunks”, which are blocks of memory that hold up to 128 entities of the same data layout. When an entity’s data layout changes because a component was added or removed, the entity needs to be moved to another chunk. This is a stop-the-world operation: Nothing can run concurrently to this move. In Unity-parlance, this is called a “structural change”.
Structural changes create synchronization points in your frame that no Entities-related async job can pass. One way to avoid structural changes is to use “enabled-bits”, which is a per-chunk and per-component-type bit field of 128 bits telling you which entities in that chunk have their component of that type enabled or disabled. Disabled components can then be skipped during iteration.
Having enabled-bits is opt-in per component type. If your components do not support them, you can just ignore them. Otherwise you have to check which bits are enabled and only iterate over the entities in a chunk that have their bits sets. For this you have to repeatedly compute the index of the next bit that is set in the mask.
My friend had rewritten the logic for getting the next bit position in the enabled bit mask to be more efficient. That logic was previously using a loop. He switched it to a branchless approach that used just a few instructions (among them tzcnt). In a real world scenario, this new approach is faster than the previous one. However, the real world test was followed by doubts and discussions, and as so often someone made the well-intended but ultimately counterproductive request of establishing a microbenchmark. So microbenchmarks were established, and the new tzcnt variant was still faster.
The performance puzzle then is this: to my friend’s surprise the tzcnt variant was also faster than just ignoring the enabled bits in their entirety. How could this be?
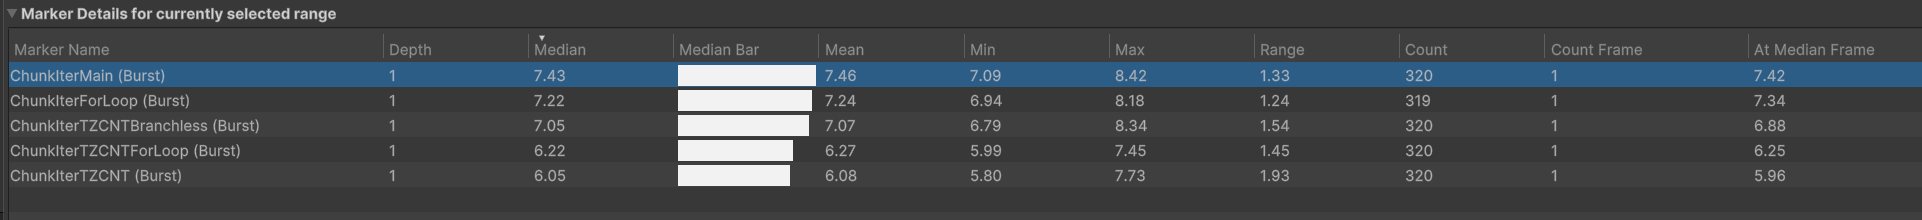
For benchmarking, there are a bunch of variants of a job that runs serially over chunks in a test scenario. The two variants we are going to look at are called ChunkIterTZCNT and ChunkIterForLoop. The former uses tzcnt plus some bit fiddling to repeatedly find the indices of bits set in the mask (which in this test scenario is filled with ones). The latter just ignores the mask and goes over all entities, which means we are doing strictly less work. There is a bit of branchy code that we execute for each entity to calculate a value, which is meant to emulate real work.
In the below picture, you can see that ChunkIterTZCNT is faster than ChunkIterForLoop when testing it on 10000 chunks of 128 entities each. There are more variants of the tzcnt approach in the pictures, but it is sufficient to just pick one of them here.
Let me show you the code for both. They only differ in how they setup the loop over the chunk before they then do some dummy calculation. ChunkIterTZCNT uses an iterator-approach. That code is not shown, it is short and not all that important. ChunkIterForLoop ignores the bit mask and just iterates over the chunk.
Here is ChunkIterTZCNT:
[BurstCompile]
public struct ChunkIterTZCNT : IJobChunk
{
    public NativeArray<int> sum;

    public void Execute(in ArchetypeChunk chunk, int unfilteredChunkIndex, bool useEnabledMask, in v128 chunkEnabledMask)
    {
        int dummy = 0;

        var chunkEnum = new ChunkEntityEnumerator(chunkEnabledMask);
        // Use tzcnt to process the mask and find the first set bit, then set it to 0.
        while (chunkEnum.NextEntityIndex(out var entityIndex))
        {
            int x = entityIndex;
            // Series of branches based on x's bits
            if ((x & 1) != 0)   dummy += 1;      else dummy -= 1;
            if ((x & 2) != 0)   dummy *= 2;      else dummy /= 2;
            if ((x & 4) != 0)   dummy ^= 0xFF;   else dummy |= 0x0F;
            if ((x & 8) != 0)   dummy++;         else dummy--;
            if ((x & 16) != 0)  dummy = ~dummy;  else dummy >>= 1;
            if ((x & 32) != 0)  dummy += x;      else dummy -= x;
            if ((x & 64) != 0)  dummy *= 3;      else dummy /= 3;
            if ((x & 128) != 0) dummy |= 0xAAAA; else dummy &= 0x5555;

            // Branches based on intermediate value
            if (dummy > 0) dummy += dummy % 10; else dummy -= dummy % 10;

            // More complex conditional chain
            if ((dummy % 7) == 0)       dummy ^= 0x1234;
            else if ((dummy % 13) == 0) dummy ^= 0x5678;
            else                        dummy += 1;
        }

        sum[0] = dummy;
    }
}
And here is ChunkIterForLoop (without the repeated dummy code):
[BurstCompile]
public struct ChunkIterForLoop : IJobChunk
{
    public NativeArray<int> sum;
    public void Execute(in ArchetypeChunk chunk, int unfilteredChunkIndex, bool useEnabledMask, in v128 chunkEnabledMask)
    {
        int dummy = 0;

        int chunkCount = chunk.Count;
        for (int entityIndex = 0; entityIndex < chunkCount; entityIndex++)
        {
            int x = entityIndex;
            /*
               same branchy code as above
            */
        }
        sum[0] = dummy;
    }
}
It took me a while to see why the tzcnt variant is faster. At some point I noticed that for some reason (foreshadowing!), the tzcnt variant was figuring out that dummy &= 0x5555 had some interesting implications on the rest of the loop if executed. I replaced the AND with an XOR and remeasured, and the results immediately shifted by 0.5ms. Whoops. Fantastic benchmark, what are we actually measuring here?
But why could the tzcnt variant make use of this knowledge, but the simple for loop could not? I could not find any instructions corresponding to dummy |= 0xAAAA either! Well, careful reading of the generated assembly showed that the compiler figured out that 0 <= x < 128 holds, because x is an index into a 128 bit mask. This meant that the tzcnt variant statically eliminated the possibility that (x & 128) != 0. The code for that branch is just gone.
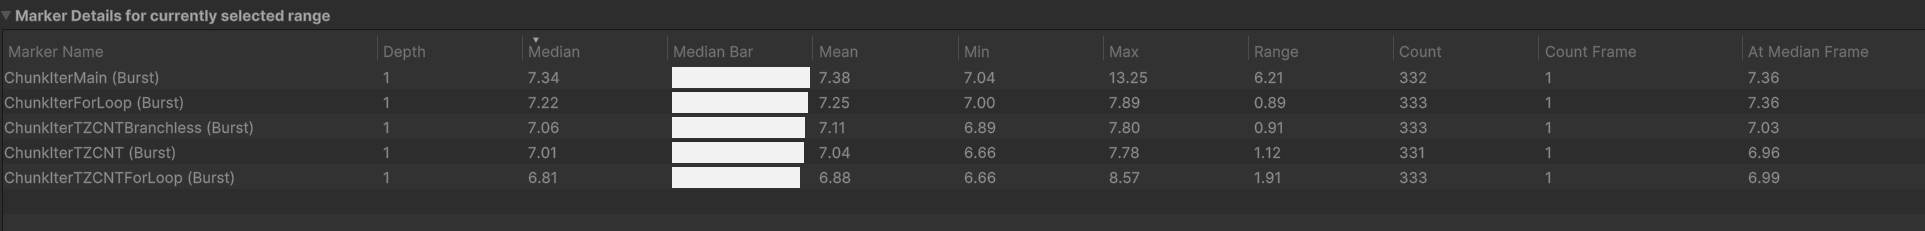
So here is what you get when you remove the branch everywhere to level the playing field:
We could have likely achieved a similar effect using Hint.Assume(x < 128) in Burst, see Assume docs. For this single benchmark, this turns out to be incredibly important. In practice, this is likely going to be completely irrelevant. This is of course only one of the many, many problems a microbenchmark could have. Maybe this one has even more!
Even with this fixed, I would still suggest being incredibly careful about interpreting the results above, unless you really know what you are doing. My point is not that one of these variants is better or not (I do have opinions!) but that this approach went off into the wrong direction.
The lesson? Don’t use micro-benchmarking to make your point unless you are also prepared to micro-profile.