As a reader of this blog you already know Superluminal, the sampling profiler that make my days more fun and my evenings longer. I want to talk about what you can see in Superluminal’s source view and how to interpret what you see there. Superluminal loads the debug information that is available for your callstack and checks if there is any mention of a source file for the function you are currently looking at. If it finds one, it tries to load it. Similarly, Superluminal will try to find the specific binary that was used, so it can show you not just the source code but also the generated assembly instructions. This last part only works for compiled languages; Superluminal does not show the generated code for C#.
You can see the assembly instructions by using this button in the top left corner:

Why would you want to look at the generated assembly instructions? Well, first off this helps you understand whether the compiler actually generated the code you expected it to generate.
Second, it can be used as a heuristic for why your code is slow. Note that this is a heuristic only, not proof, but is often a good start. As a gross simplification, we can say that code is either compute-bound or memory-bound. Is there just a lot to compute, or are you just continuously missing cache and need to wait for data to come in from memory?
If you want to sound smart in front of your friends when talking about performance, you can always just let out a long “hmmmmm, it’s probably memory bound.” On average, you are probably right! If you want to get even better accuracy, read on.
As a first word of caution, please note that as usual you should ensure that you have sufficient samples in your function to even make any sense of them. Looking at single samples is not meaningful. Looking at their distribution is.
Consider these two snapshots of samples:
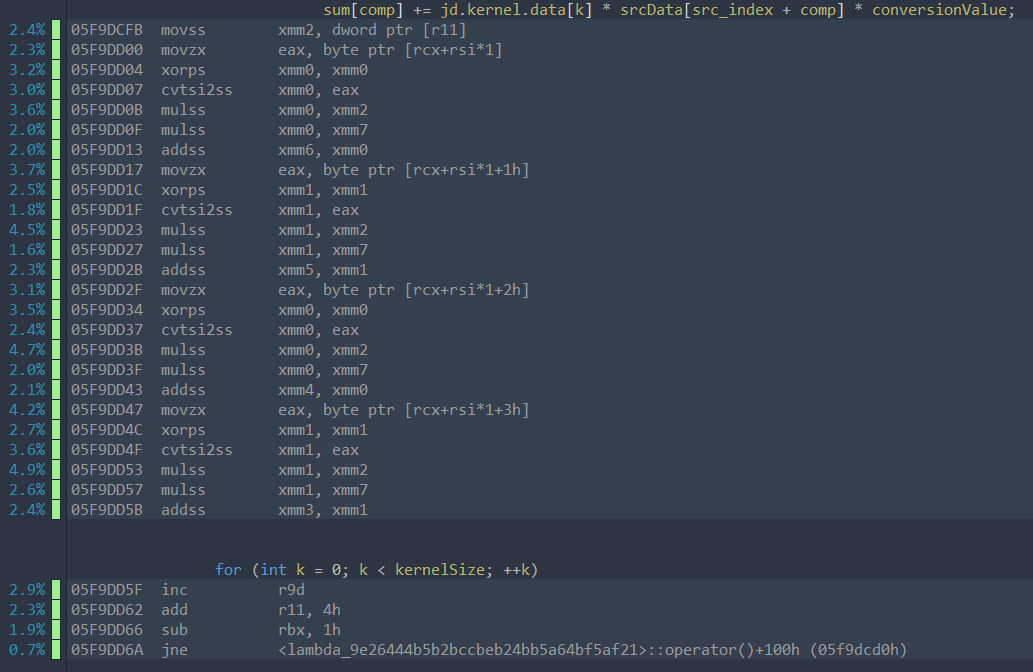
In the first picture, you see a bunch of samples that are “smeared” across multiple instructions. It’s not perfectly uniform, but none of the instruction really stick out. This is a sign that this code is likely compute-bound (and in this specific case you would want to maybe manually vectorize it – the only slight annoyance here is the movzx). From a sampling perspective, a near uniform distribution means that you are equally likely to observe any of the instructions, which suggests that they all take similar amounts of time (with some hand-waving around the complexities of CPUs).
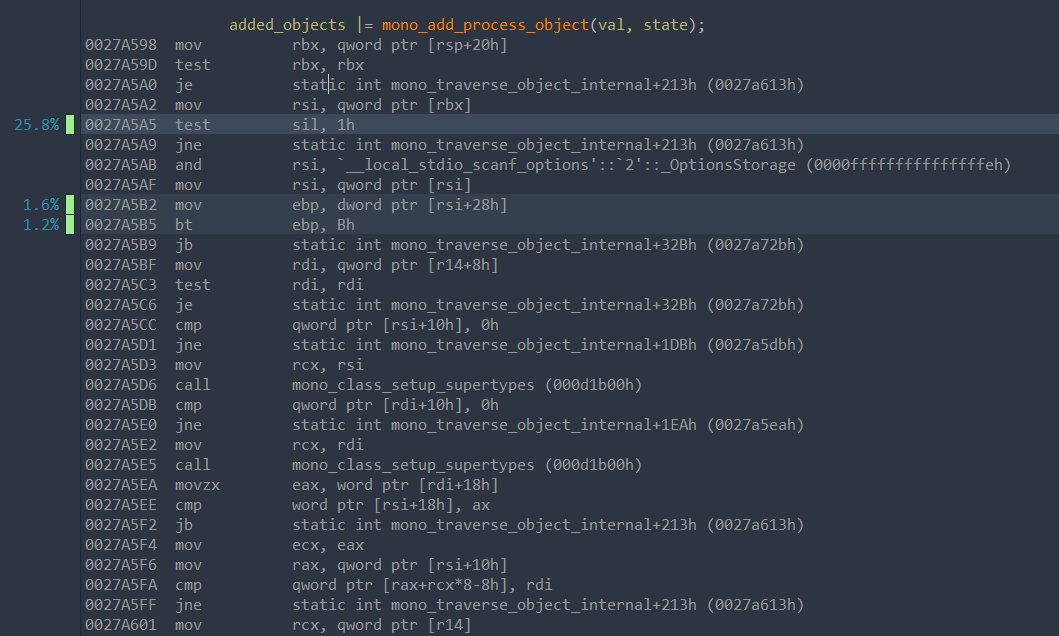
However, almost all of the samples shown in the second picture fall on a single instruction. I would be generally careful to look at single instructions like this, but this suggests that there is a single point here that is orders of magnitude slower than the rest of the operations, which is why samples accumulate there. The most likely explanation for that is that some memory access misses cache and stalls on this instruction because we wait for memory (or on some instruction nearby – be careful and don’t blindly trust this – it’s a heuristic). All of this rests on the assumption that the most likely thing that makes an instruction suddenly take much much longer than its surrounding instructions is missing cache.
Take a closer look at the instructions just leading up to this accumulation of samples:
0027A598  mov          rbx, qword ptr [rsp+20h]
0027A59D  test         rbx, rbx
0027A5A0  je           static int mono_traverse_object_internal+213h
0027A5A2  mov          rsi, qword ptr [rbx]
0027A5A5  test         sil, 1h
We read from the address pointed to by rbx and store the result in rsi. This read is missing cache. Then we check sil, which are the lower 8 bits of rsi, and we stall here because we have a direct dependency on the result of the memory read. The previous read from [rsp+20h] on the other hand reads from the stack, and that is virtually guaranteed to be in cache. If we combine this with the meta-information that this is object traversal code in mono where we jump from object to object by following the references in the object’s fields, this sounds like a reasonable theory: jumping to another object in such a broad traversal is likely missing cache.
As a general rule of thumb: if samples accumulate on a single instruction, look for dependency chains and formulate a hypothesis for whether this could be a cache miss. If you do not trust your theory, or you need to understand say what level of cache you are missing, or you come to the conclusion that you are probably compute bound without obvious possible improvements, then I strongly suggest using micro-architectural profiling tools (like VTune) to actually understand what is going on in detail.