A common complaint among Unity users is that the Editor is slow and that common operations take a long time. This is commonly referred to as “bad iteration times” because it hinders your ability to iterate on your project. In my time with Unity I have looked at many Unity projects of all sizes. As I have just left my job, this is as good a time as any to collect some thoughts as to why projects are “slow.”
I’m trying to paint a broad picture. In some cases, I may trade technical accuracy for brevity – this post is going to become too long in any case. You may want to jump around as I have probably failed to tell a linear story here. I know that this post is going to read like a long list of things that you should not do if you don’t want to have a “snappy” project (within reason – there is a limit to the snappiness you can achieve at a certain size given the architectural constraints of Unity), and in many cases I might not be able to tell you what you should do instead. It’s almost always easy to write code that is slow, and finding alternatives is not always that simple (within the context of Unity). I’m also going to just talk about the user-facing side. If you happen to work on Unity’s native codebase or have source access, there is more to be said still.
As few final words before we get into the actual meat of this: “All fast Unity projects are alike; each slow project is slow in its own way.” (here) – The advice here may or may not be applicable to what you are doing, and you may get away with doing many of the things I list here while something else will completely blow up. That’s the sad truth: One bad mistake can turn a sluggish project into a catastrophically slow one. And even if you do all the things right, you may still end up with “sluggish” at a certain scale.
Oh, and as of writing this should apply to everything up until Unity 2023.x.
First, Measure
Before we talk about any reasons for why things are slow, the most important thing to establish is that you need to start measuring the performance of your editor workflows regularly. Yes, you. It’s not exactly great that this is on you, but this is the best way to stay on top of things and have a good editor experience. You should assume this responsibility, in your own self interest. Some of the nicest projects I have looked at had a warning popup if an asset import took longer than a second so that whoever ran into it could escalate it to a programmer on the project, or they always logged the time it took to enter playmode.
The best way to measure the performance of the Editor is to use one or multiple profiling tools. My weapons of choice are Superluminal (Windows only, the gold standard for sampling profilers) and the Unity profiler. Superluminal is a fantastic tool to have in your toolbelt in any case and I have made a video about using it with Unity some time ago. The Unity profiler on the other hand is an instrumentation-based profiler and is useful because it surfaces a lot of Unity specific information, e.g. it can show you which GameObject specifically has the MonoBehaviour whose Awake() is taking 600ms.
Additionally I would suggest that you instrument the most common workflows (see below) in your project for your team and then collect the data centrally. It takes a bit of creativity to be able to measure some of the workflows, but it’s possible and it will allow you to monitor the health of your project over time.
Common Workflows and Reasons for slowdowns
Here are common user workflows that frequently become “slow”:
- Opening a project,
- Entering playmode,
- Making a script change,
- Modifying an asset,
- Editing a prefab,
- Making a build.
Common reasons for wait times are:
- Domain reloads,
- Serialization,
- Script compilation,
- Asset importing,
- Asset loading,
- Callbacks into C# code.
I will first talk about the different reasons for slowdowns, and then map the workflows to the reasons. Then I will give you any residual advice I might still have. I’ll just warn you right now that I don’t have much to say about builds, unfortunately, and there are no magic tricks or silver bullets.
Reasons for slowdowns
Domain Reloads
Domain reloads are a topic that you cannot get around when you spend any time working with the Unity editor. “Domain” here refers to the code domain of the Mono runtime that is powering Unity’s C#. Whenever you make a change to a script Unity needs to reload that code. However, Unity doesn’t have the ability to “just” reload single scripts by themselves (or assemblies, for that matter). It’s not hard to see that while it is possible to support a subset of code-editing operations with immediate hot-reloading it’s not so simple at all to do this in general. For example, when you change a script that contains data definitions (that’s the common case) then that data layout could have changed, so all data needs to be reserialized. What this effectively means is that any change to a script will not just trigger a compilation but also a domain reload, which invalidates all C# state.
During a domain reload, the following steps happen, roughly:
- Back up all serializable data from C# (this incurs the overhead of serialization, please read about that below),
- Unload the existing domain, which drops all state in C#,
- Boot up a new domain and load the new code,
- Deserialize data from the back up we made earlier,
- Execute initialization logic; we dropped all C# state earlier so we’re essentially back to a blank slate.
As you can imagine, there are a myriad of ways how this can get slow. Even if you don’t do anything particularly stupid, you’re still looking at a process that usually takes ~10s. The thing I want to call out here is the initialization logic: Whenever you write a static constructor or put an InitializeOnLoad attribute (here, or here) on something, you increase the amount of code that needs to be executed when a domain reload happens. There are more ways to have code run here (e.g. Awake or OnEnable on scriptable objects), a profiler is your friend. Running code here is doubly bad:
- First, all code that runs after a domain reload will need to be re-jitted. C#/Mono uses a two-tiered compilation model where there is a first compilation step from C# to CIL (Common Intermediate Language) - that’s what you commonly refer to as “compilation” - and a second step from CIL to actual machine code that occurs when the code first executes (“Just In Time” or JIT compilation). This jitting needs to be performed from scratch every time the domain is reloaded for all code. Jit-compilation results are not reused between domain reloads. There are some odd exceptions, but that’s the general rule. Especially in “fast” projects, a good 30%-50% of total domain reload time could go into just jitting code. Jitting is also affected by some lock contention in Mono, so parallelization can make things worse.
- Second, this code executes a lot, and it’s super easy to put things there that are slow, or slow at scale, or slow when combined with a million other things. Besides the general fact that Mono’s C# implementation is frequently an order of magnitude (or more!) slower than native code, initialization code is often written with little care as people assume that it only executes on program start. For example, people use AssetDatabase.FindAssets to find some configuration file. Guess how this operation scales with project size! Initialization code runs after every domain reload, and if you want to avoid repeating expensive logic consider caching your data in the SessionState.
As you can imagine, both packages (official ones from Unity or other ones), asset store items, and other 3rd party code often come with some sort of initialization logic. Even if it’s just a little, I can virtually guarantee you that installing any package or downloading any scripts from the asset store will cost you during a domain reload. Maybe just a bit, but often a lot. It’s unfortunately on you to apply due diligence here. Measure, measure, measure.
Serialization
We just talked about domain reloads, and domain reloads are one of the cases where serialization performance really matters. In this context, serialization turns C# objects into some format that can be persistent. Deserialization is the inverse process. There are three ways in which serialization becomes problematic:
- You serialize big objects. That happens frequently because you have large arrays of data or very long strings, or maybe even arrays of very long strings. Serializing strings is not free, especially because there are conversions between UTF8 and UTF16 involved and because deserializing strings means calling into Mono to create a string object. That may not sound so bad, but Mono’s implementation for GC allocations may take various locks. This means that when there is another thread that also tries to do anything with the GC (e.g. allocate), this can cause plenty of contention. This contention is very common (also outside of serialization), especially during a domain reload: A domain reload often follows a script compilation, and a script compilation means that Burst could be compiling something, which means that you have a whole bunch of threads in the background allocating left and right.
- You serialize many objects. Obviously, this scales with the number of objects. But the number of things that are serialized sometimes lead to surprises. For example, all
SerializableObjectinstances are serialized. This means that the cost of serializing all objects (e.g. during a domain reload) very clearly depends on what editor windows you have open: Editor windows are scriptable objects, scriptable objects are serialized. It’s so significant that closing windows can have big effects on total timings. Now of course we only need to serialize things that are actually loaded into memory, so just having a scriptable object in your project somewhere likely won’t cost you, but once you clicked on it and looked at it, it’s in memory. Unity has measures to automatically (or explicitly) perform garbage collection of unused assets, so these scriptable objects could be unloaded automatically, but it’s also not hard to create leaks where objects are never collected. Unity essentially needs to crawl the entirety of the managed memory space to figure out which assets are still reachable. The crawling starts at well known entry-points such as static fields. If you have a serialized object that puts itself into a list of, say, all instances of that type in itsOnEnable(), then it is never going to be garbage collected. I remember case where the VFX graph importer could create millions of scriptable objects and leaked them. Before we fixed that, this could make domain reloads take minutes! This can be diagnosed with Unity’s memory profiler, and entry-points for leaks can be explored using this heap explorer tool. - You have written a custom (de)serialization callback. This means that essentially arbitrary code can run during serialization. When used carelessly or even just at scale, this can become very slow. For the most part, Unity’s serialization code can run in native code but serialization callbacks means that we need to drop down into slow slow slow C# code. Use with care.
To a lesser degree, (ab)use of certain serialization features such as SerializeReference at scale can also slow down serialization. As with everything else, there is a trade-off here but you should be aware that using this a thousand times is not free. Also, C# constructors and OnValidate() callbacks are executed during deserialization of data (because Unity needs to create C# objects), so be careful what you put in there.
Oh, and some bonus knowledge: It’s a common assumption that Unity doesn’t serialize private fields, but it does, sometimes! Read the section about Hot Reloading on this page for details. This implies that private fields cost just as much since Hot Reload is actually the common case of changing scripts where everything is serialized. There’s an attribute you can use to disable serialization for fields.
Script Compilation
When you make a change to a script, that script needs to be recompiled. In Unity 2021.3 and later, this recompilation can happen in the background, asynchronously. Unity tries to be smart about what gets compiled, which is where assembly definitions become relevant. Unity will normally just compile the assembly definition whose files you touched plus all of its dependencies. This makes it sound like having as many assembly definitions as possible is the most efficient setup, but that’s not actually true in reality. I have seen projects where every folder had its own assembly definition, and compile times where abysmal. First, there is some fixed overhead per assembly definition. Second, whenever there is a collection and you make that collection big, chances are that something is going to fall over (in this case e.g. traversing dependencies or calling per assembly definition callbacks). If many people have already explored this axis at its extremes, odds are that someone put work into optimizing it. How many people are there with 1000 assembly definitions? Not many, hopefully. I’d rather look for a good middleground between size of assemblies and number of assemblies.
In contrast to the Mono runtime, the compiler Unity is using is usually close to the latest and greatest officially sanctioned Roslyn compiler. There are a few other factors that can affect compilation time:
- Roslyn analyzers and source generators run as part of the compilation process and can slow down your process. Profile them often. Note that Unity’s compilation with Roslyn runs on a modern dotnet runtime, not on Mono, so the performance characteristics are different. Anecdotally, I can tell you that symbol resolution is often a slow part.
- Burst compilation happens after regular compilation and usually happens in the background. It could be promoted to a blocking foreground process when you enter playmode or when you use the options for synchronous compilation (so don’t use them!). Burst first needs to detect what has changed at all and then it needs to actually compile your code. This second step is using LLVM as a backend. My last profiling suggested that LLVM on Windows suffers greatly from using default system allocators and the compilation process could be sped up quite a bit by using just slightly more sophisticated allocation strategies. I don’t have first-hand experience with the LLVM codebase, so I don’t know how low-hanging this fruit actually is. Anyway, I digress. The other part is the C# part of Burst, which as of Burst 1.8 runs on Mono and makes heavy usage of all your background cores. This then again causes contention for both GC allocations and jit compilation. Additionally, having all your cores sit in the background compiling code for minutes can slow down everything else just because of the general system load you’re experiencing. Burst is a double-edged sword.
This might also be a good opportunity to point out that the amount of code you need to compile varies with which packages and asset store items you install in your projects. Packages that are embedded in the project (via file:\\) will often contain their tests by default, for example: If the package was just referenced, the tests are mostly skipped (even if they are physically present - the assembly is excluded from the project).
Oh, and there’s a tool here for visualizing the compilation timeline. I have not tried it, but I have heard good things.
Asset Importing
Asset importing is the process by which Unity takes some file on your disk and turns it into something that’s useful in the editor. For example, when you put a texture into your Unity project folder the texture needs to be converted into the right format for the GPU, it needs to be compressed, mipmaps need to be computed etc. – Asset importing itself can be very expensive and the time it takes greatly depends on the type of asset. Textures are the slowest by far and models with animations come in second place. There are some other odd-balls that can be slow at times, e.g. ShaderGraph and VFX Graph asset imports. An asset can and will be reimported a multitude of times during its lifecycle: There’s a dependency tracking system in place and whenever a dependency of an asset changes, the asset is reimported. The most common case for this is that you change your file on disk, which Unity then detects by running an Asset Database Refresh (see also the note about batching). In Unity, asset imports are almost always blocking. Exceptions exists, e.g. the scene importing for DOTS is on-demand and asynchronous, but as said - that’s the exception. Since Unity 2022, there is an option to at least import some asset types in parallel, which can greatly speed up import times. I digress.
Another important dependency for assets is the platform you are building for. This is the main reason why switching platforms may trigger asset imports. It is in general a good idea to strictly limit the number of dependencies that your import results have. That may be beyond your control for Unity’s importers, but it’s good to know about.
Here are two more notes for asset imports:
- First, you can write your own asset importers in C# using Scriptable importers. Unity has some for Shader Graph and VFX Graph, and it’s no coincidence that I called them out as slow above (at least in some cases). Mono’s C# is slow and asset imports happen frequently, so if you go down this route you must regularly profile your importer.
- Second, asset imports trigger asset postprocessors. Asset postprocessors should be used with extreme care, or ideally not be used at all. This is user code that may run for every imported asset. OnPostprocessAllAssets is especially bad – imagine what happens when you open a large project and someone passes you an array of 500k assets because that’s what was imported on project startup. Most tools just choke and die. But that’s just one of the worst parts. Did you realize that changing a C# script constitutes an asset import and will trigger asset postprocessors? (This may have changed in the very latest Unity release, but I don’t know for sure.) And did you know that asset postprocessors are often in the package or asset store items you install?
I should also point out that since textures are so important it makes sense to spend some time and get acquainted with the texture import settings. In reality, most of the import time for textures is actually just compressing them: It’s so important that the build settings even have a separate override to override the compression used for a build. Aras also has a nice piece about texture compression here that you should go and read. There are also some settings in the project settings related to compression. It’s a pity that all these settings are so spread around.
For textures used as sprites, consider disabling Generate Physics Shape when you don’t need it, see here.
For models, there is a wealth of information in Unity’s documentation. There is probably a tech artist out there that can give you a full rundown of what is good to know. My bit is just that using USe External Materials (Legacy) in the Materials tab can cause plenty of searching as Unity tries to figure out what materials go with which model, and that’s slow.
Using Unity’s Preset Manager is one way to set default import settings for your project, consider using it.
Asset Loading
Asset loading in Unity is expensive, and I hope this is not surprising. I’m still calling it out separately because it’s important to understand. Unity mostly loads assets when they are used in the editor and assets are generally speaking only unloaded every once in a while when an asset garbage collection is running. This means that running an operation for the first time is generally speaking slower than when you repeat it. There are of course more factors like caches e.g. in the file system level that also affect this, but if you wonder why something is slow sometimes, then look out for asset loading (or shader compilation, actually).
Callbacks Into C# Code
Unity has an incredibly extensible editor, and most of this is achieved by calling into C# code. With packages, much of Unity’s code itself is now in C#. There are more callbacks into C# code from Unity’s core code than I could list out. It is incredibly easy to put something into these callbacks that makes things slow. Literally every click in the editor can be affected: you could hook into object selection, into undo operations, into the inspector header GUI etc. – the list is long and grows with almost every release.
The first realization you need to have is that Mono’s jit compiler is nowhere near the state of the art anymore and does not provide anything that could be considered good performance. When you run in Debug instead of Release, things get even worse. Mono has done a lot of good, but its implementation is outdated and you merely need to look at the generated code to realize that you do not want to run much code in C# at all. Unity knows that and has stated that they are investing into migrating to the more modern CoreCLR runtime, where performance can often rival native code.
But that’s in the future, and we’re unfortunately stuck in the present for now. Until then, it is a good idea to take any C# best practices that are geared towards regular non-Unity C# developers with a good pinch of salt and instead apply due diligence by measuring. All the general advice about using the right datastructures for the right job of course apply but the mechanics of implementation are way more important in Mono’s C# because the jit compiler takes things very much literally. Anything that you wouldn’t put into a game should also be considered with scepticism in editor code, but you can also get some mileage by at least avoiding common problems – e.g. use ordinal string comparisons when your code doesn’t deal with exotic unicode text.
The ease of use of all the different editor callbacks and hooks also means that now everyone can ruin the performance of your workflow. Sure, that asset store package does look nice, but have they tested it in a project with 10000 script files? Or a scene with thousands of objects? Or a project with a million assets? - Besides the fact that the mechanics of implementation become very relevant with Mono’s C# runtime, the algorithmic side is still a huge factor and the number of axes that code needs to scale on in Unity is big. It’s incredibly easy for someone to write code that is, say, quadratic in the size of your current selection in the editor. LINQ for example can hide a ton of linear loops behind single-word method calls (Where, Any, …) and combining this carelessly is a recipe for disaster. Any loop over a collection that is not bounded by a small constant across all Unity projects will become a problem at some point. It’s easy to say that “you will optimize this when a user reports a problem” but figuring out why your artist had to stare at a progress bar for 2 minutes isn’t trivial at all when you don’t sit with them and don’t have a profiler perpetually attached to their machine.
Avoid the obviously stupid, assume everything is slow, and then measure, measure, measure. There are too many vectors here to cover them all.
Common Workflows
Opening a project,
Opening a project can range anywhere from “it takes days” to “it takes seconds.” Usually, the most important factor for the time it takes to open a project is whether you have opened that project before and whether there have been any changes in between. If you have not opened a project before, all assets in that project will need to be imported. Unity generally imports assets upfront, and that’s why opening a project for the first time can take hours. You could run into a smaller version of the same problem when you work in a team, pull in the latest changes, and now have a handfull (hundreds?) of changes to assets. The main driver for project load times then are asset imports followed by a “sort of” domain reload: there is no domain to unload yet, but all the initialization work for managed code still needs to happen since the new editor instance comes with a new Mono domain.
This may be a good time to note that Unity technically has a solution to share the import results between multiple users though I have not seen anyone implement this successfully in practice and at scale. The empirical evidence suggests that this particular implementation isn’t quite ready for use at scale.
Entering Playmode
Entering playmode is a core workflow and usually consists of the following major steps:
- The current scene is backed up and reloaded. This incurs some serialization cost. It’s not free, but in most of the projects I have seen this has not been the biggest offender. Serialization is usually worse in other places. The main driving factor is scene size.
- The Mono domain is reloaded to ensure that a clean slate is present (as would be the case when the game is launched standalone). This step can be extremely expensive because domain reloads are expensive, as detailed above. There is an option to skip this step but it requires a lot of cooperation from essentially all code in your project. I would highly suggest turning this option on for new projects but be prepared that any and all old code may have to be scrutinized for difficult to find bugs.
- Some post-processing scripts run to ensure that the scene you are entering into is similar to how it would look in a standalone build. The callback I have in mind in particular is PostProcessScene. This is also invoked when making a build and some actions might be appropriate for builds but not for entering playmode. I have seen asset store packages take seconds in this callback, so I advise you to measure yourself. Static batching of geometry is also running as part of this step, which can become expensive for large scenes with a lot of static geometry. In my experience there are better approaches to rendering large amounts of (probably duplicated) static geometry, but they require manual plumbing, e.g. using BatchRendererGroup.
- More callbacks! E.g. RuntimeInitializeOnLoad, InitializeOnEnterPlaymode, or EditorApplication.playModeStateChanged. There are probably more, but all of these are public callbacks that third party code will use. Measure and profile, no easy answers here.
- The scene is initialized. This means that
Awake(),Start(), andOnEnable()are called on all relevant objects in the scenes you have loaded. This is essentially emulating what it would be like to try and load this scene in a player build. Unsurprisingly, this means that if you do any precomputation, filling up of pools, shader prewarming, data loading, web-request sending etc. it’s all happening here as well. Anecdotally, I saw a project where entering playmode spent a second baking a mesh collider that was using a render mesh. It’s not uncommon that this block of initialization is the vast majority of the time it takes to enter playmode and there is again no easy answer. Measure your code.
Making a script change
Making a script change incurs what are probably the worst costs in combination. I think it’s all covered above, but let me list it out:
- Changing a script means changing an asset on disk, so an asset import happens and asset postprocessors execute.
- A compilation is triggered.
- Once the compilation is done, a domain reload happens.
The details here of the precise ordering can be found on this page. This can be a lot and you can get a discount if you disable Auto Refresh in the preferences. When you do this, the editor won’t detect asset changes on disk automatically anymore but you need to manually trigger them. It takes a bit of getting used to but can save a lot of time.
Modifying an Asset
See the section about asset importing above. The specific cost depends on the type of asset and the asset postprocessors you have in your project. Minimize the latter and become good friends with the asset import settings for the various asset types. Keep source assets out of source control, but if you can’t exclude them at least put them into a hidden folder.
Editing a Prefab
Editing prefabs is close to asset importing, but there’s a twist! Since the introduction of nested prefabs and prefab variants it has become very easy to construct deep dependency trees among prefabs. In particular, changing a prefab means that any variant of this prefab and any other prefab containing an instance of this prefab needs to be touched. This can quickly become very annoying, to the point that making a change to a prefab leads to minutes of waiting. This is especially common when you e.g. click the prefab asset in the project window and immediately start editing in the inspector: Any change causes stalls. You can instead open the prefab in Prefab Mode, make all of your changes, and then save: This way you only pay the cost for imports once at the end instead of at every modification. Alternatively, avoid deeply nested prefabs from the beginning in your project.
It’s also worth noting that if you have a large scene open with thousands of prefab instances in it and you then make a change to the source prefab, all those instances need updating. So consider switching to a smaller scene before making your edits.
Making a Build
Making builds is often one of the slowest processes. I have to admit that I don’t have much insight here about all the different ways that this can go wrong, but will elaborate a little bit. It’s worth pointing out that the “happy path” for builds in Unity can be very fast if you can make use of the incremental build pipeline. See the documentation for platform compatibility. Incremental builds are especially fast when you only make script changes. It makes sense to try to keep that as your default. However, there are some operations that cannot be done incrementally (see the docs above again) and my experience with how the incremental build pipeline interacts with other parts of Unity (say, scripted importers or DOTS) or with deeply customized build scripts is limited.
Other notes:
- You can use the asset import override feature from the build settings to change texture import parameters globally, which can greatly speed-up builds at a quality trade-off.
- When making IL2CPP builds, make sure that you also look at the C++ compiler configuration options in the player settings. Even if compilation for incremental builds is super fast, a wrong value here can doom you to 20 minute link times due to whole program optimization.
- There are again many options for inserting custom code into the player build pipeline. There are the typical build callbacks around IPostprocessBuildWithReport and anything in its namespace, but the most interesting ones are probably the shader stripping and filtering callbacks. In big projects with many shader variants, you can end up with huge lists of variants to filter, which can slow down shader processing.
Random Advice
I have more to say but not everything I want to say fits into the above format. I hope the following is helpful:
- Measure! Profile and collect data.
- Thou shalt not call
AssetDatabase.FindAssets. Of all APIs, this is probably the one you want to avoid the most. As mentioned earlier, this method is frequently used to find e.g. configuration assets used by some script, often coming from an asset store package. In the most common cases, there is no need to call this API during each domain reload: It is very unlikely that such configuration assets move all of the time and you are better of caching their path using theSessionStateAPI. Consider using the Unity Search and its API to do asynchronous searches, but be aware that the Search functionality is index-based and while updating the index is async and happening in the background, it’s also not free. - Use the TypeCache instead of reflection where possible.
- Avoid calling
AssetDatabase.GetDependencieson large scenes when looking for recursive dependencies. In order to find dependencies, this function needs to actually open up files and read them, and scenes often have many dependencies, which can make this extra bad. Dependencies aren’t cached or precalculated, it’s actually just that expensive. I have seen cases where asset store package cost seconds because they crawl dependencies like this. - If you are performing multiple operations on assets, use proper asset database batching. The TL;DR is that without batching every operation will trigger an expensive refresh, with batching you get one refresh for all of the changes.
- Remove all packages and asset store items that you are not actively using from your project. Actively audit the list of preinstalled packages when you create a new project.
- Consider disabling Burst when iterating on scripts.
- Become familiar with the project settings and preferences. There may be options there that improve the editor’s performance in some situations, e.g.
Enable Texture Streaming in Play Mode. - Delay initialization logic as much as possible such that it runs when it is needed instead of on every domain reload.
- Avoid using Object.FindObjectsByType and similar APIs (e.g.
GameObject.Find,Transform.Find,Resources.FindObjectsOfTypeAll– they are all searches and not a good idea). The new version of this API that doesn’t sort is faster than the old, but this is still not fast. The cost for querying objects also varies by type; querying for types that have no native representation (e.g. any of your MonoBehaviours) is especially slow. The performance here scales not just with the number of objects in your scene but can also be affected by all sorts of other objects that only exist in the editor, for example editor windows. Many of the Editor Window APIs use this one under the hood, so be careful what you call. - Avoid operations that generate garbage where possible. Allocating GC-tracked memory causes lock contention and will lead to more frequent garbage collections.
- If there is a long stall that you cannot reproduce, try clearing the shader cache. Shader compilation is sometimes still blocking in Unity and may not always be surfaced as “shader compilation.” You should probably read this page about async shader compilation to better understand when compilation is async and when it isn’t.
- If you are writing C# code, assume everything is slow.
- You’ll be more successful if you assume that you can measure and positively affect the performance of your project in the editor, even if you are “just” an end user.
- …measure!
Appendix
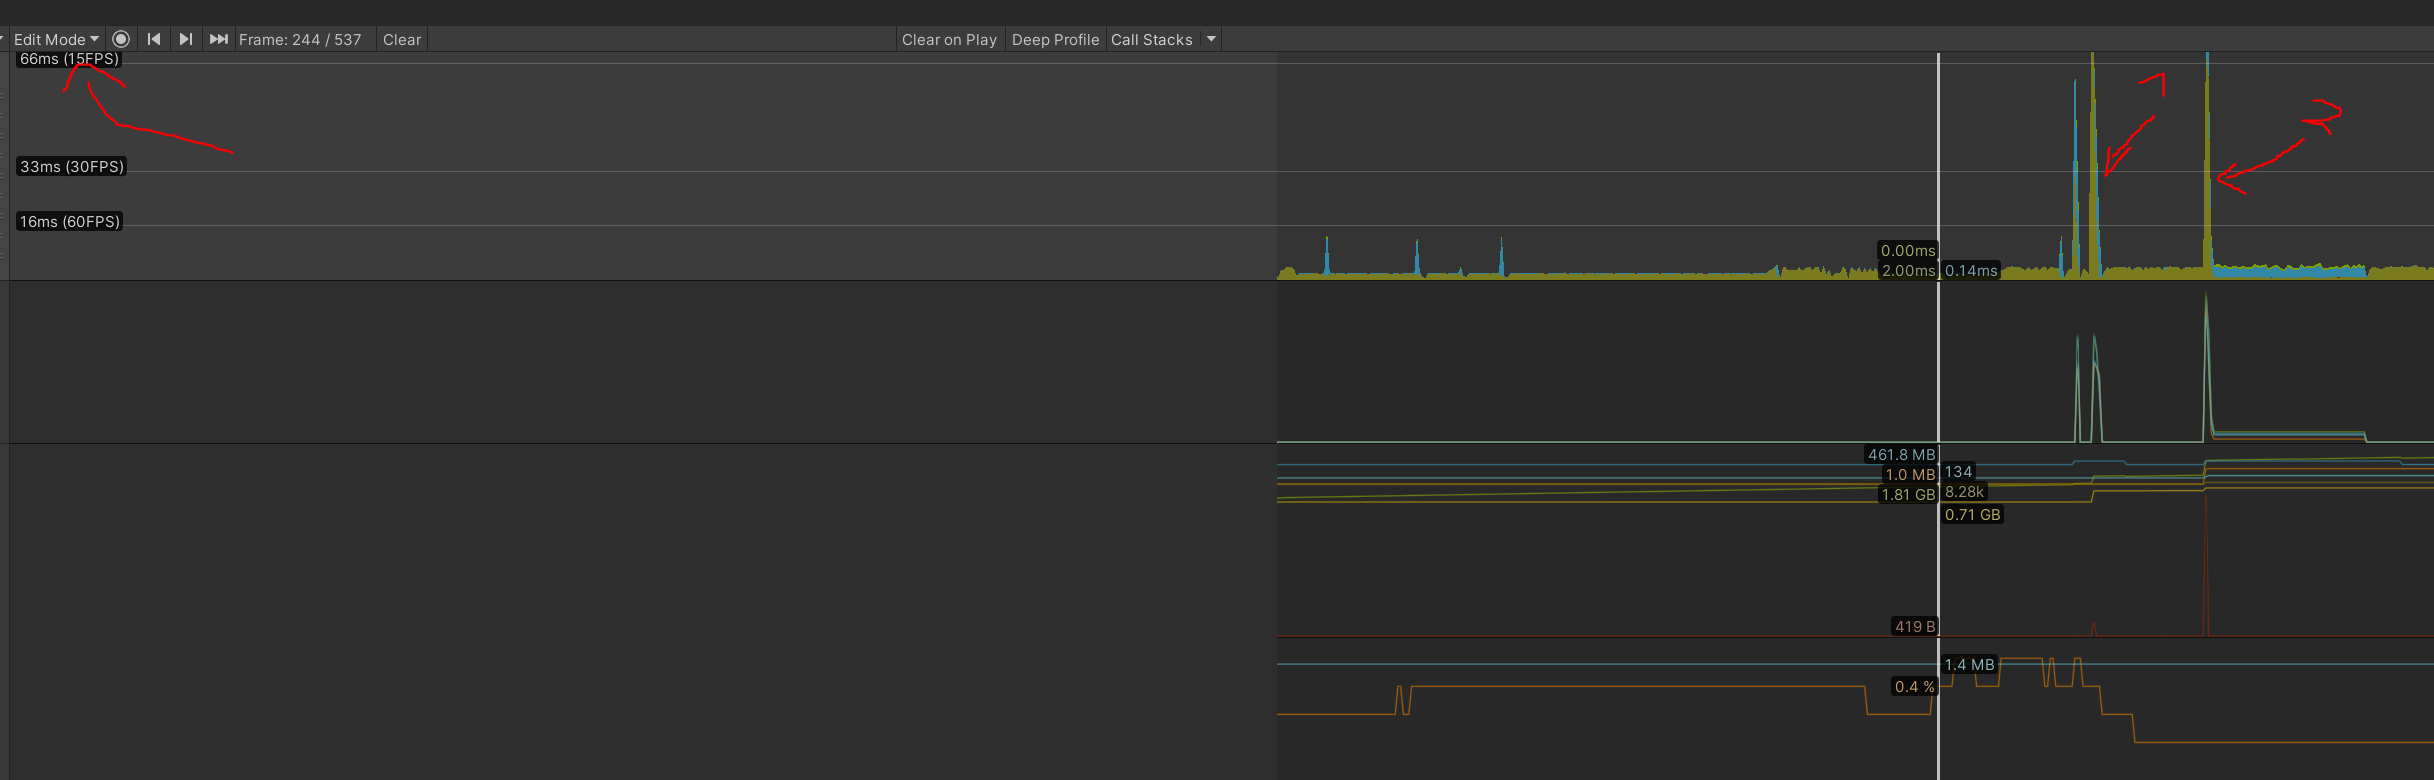
A profiler capture of script compilation
I’m not sure how helpful this is going to be, but to encourage you to use a profiler I thought it might be a good idea to just show you what to look out for.
When you perform a script compilation, you are going to see two spikes: One for kicking off the compilation, then another one for the domain reload. The time in between is the time it takes to actually compile the code. This is usually async and in the background. Also note that the profiler is set “Editor” in the top right. Yes, the profiler drawing will affect our timings, but that’s not relevant when you are looking for one-off events that take seconds:
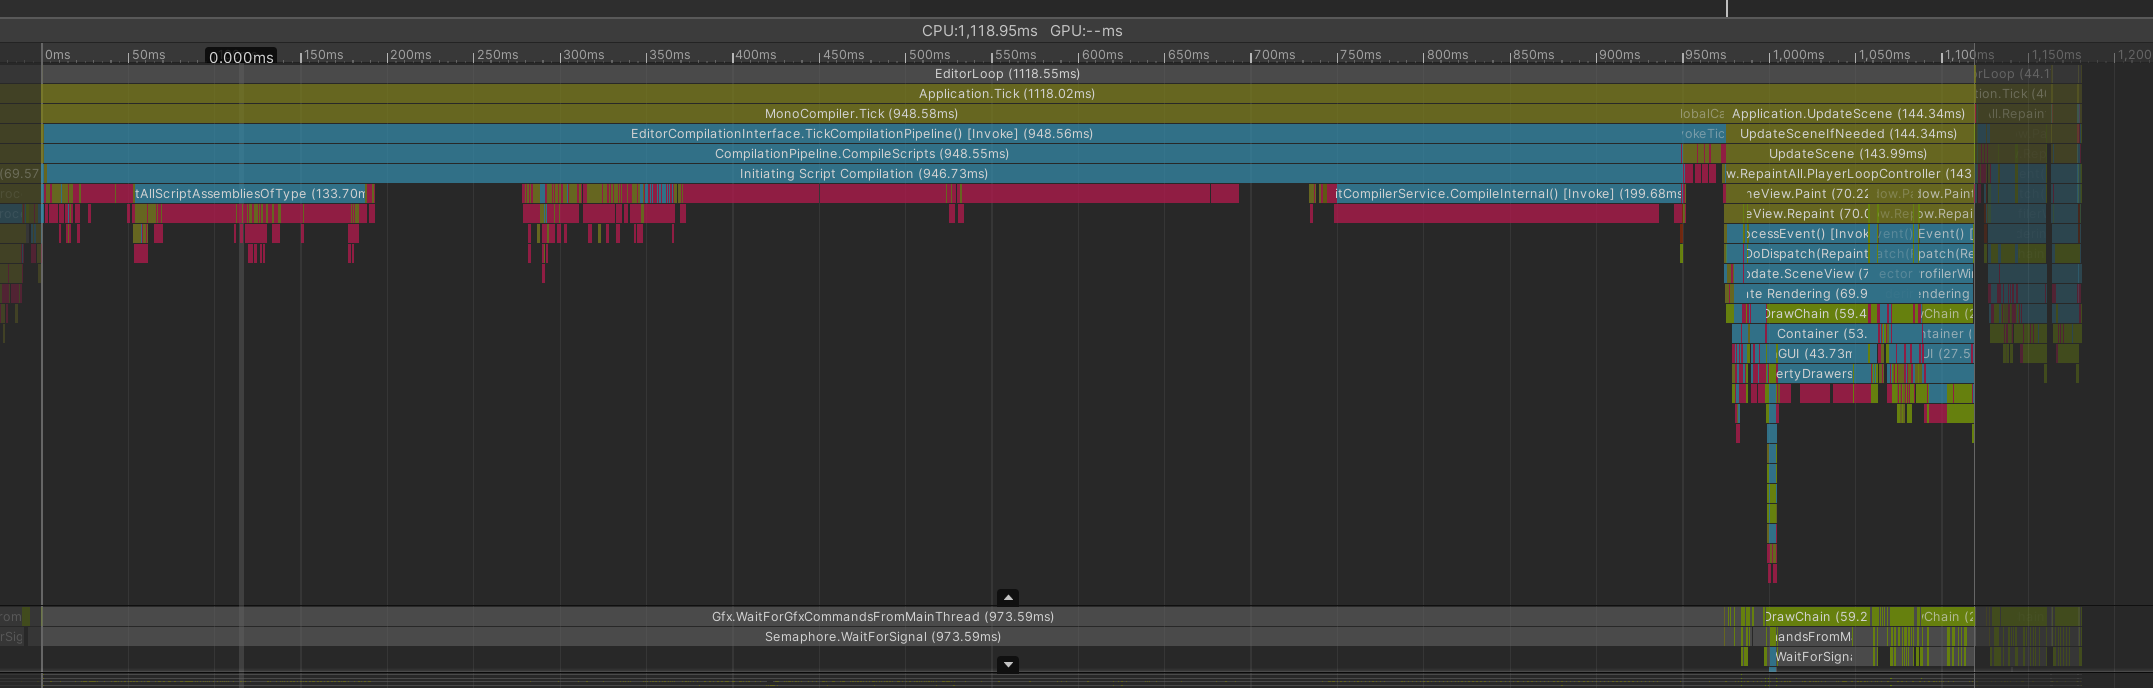
The compilation kick-off looks like this and I don’t think there are any callbacks that you are responsible for. It’s mostly a matter of project size (and all the different ways to quantify that, e.g. number of assemblies and scripts is particularly relevant here):
The domain reload part is more complicated and looks like this in the project I have open (Boss Room):
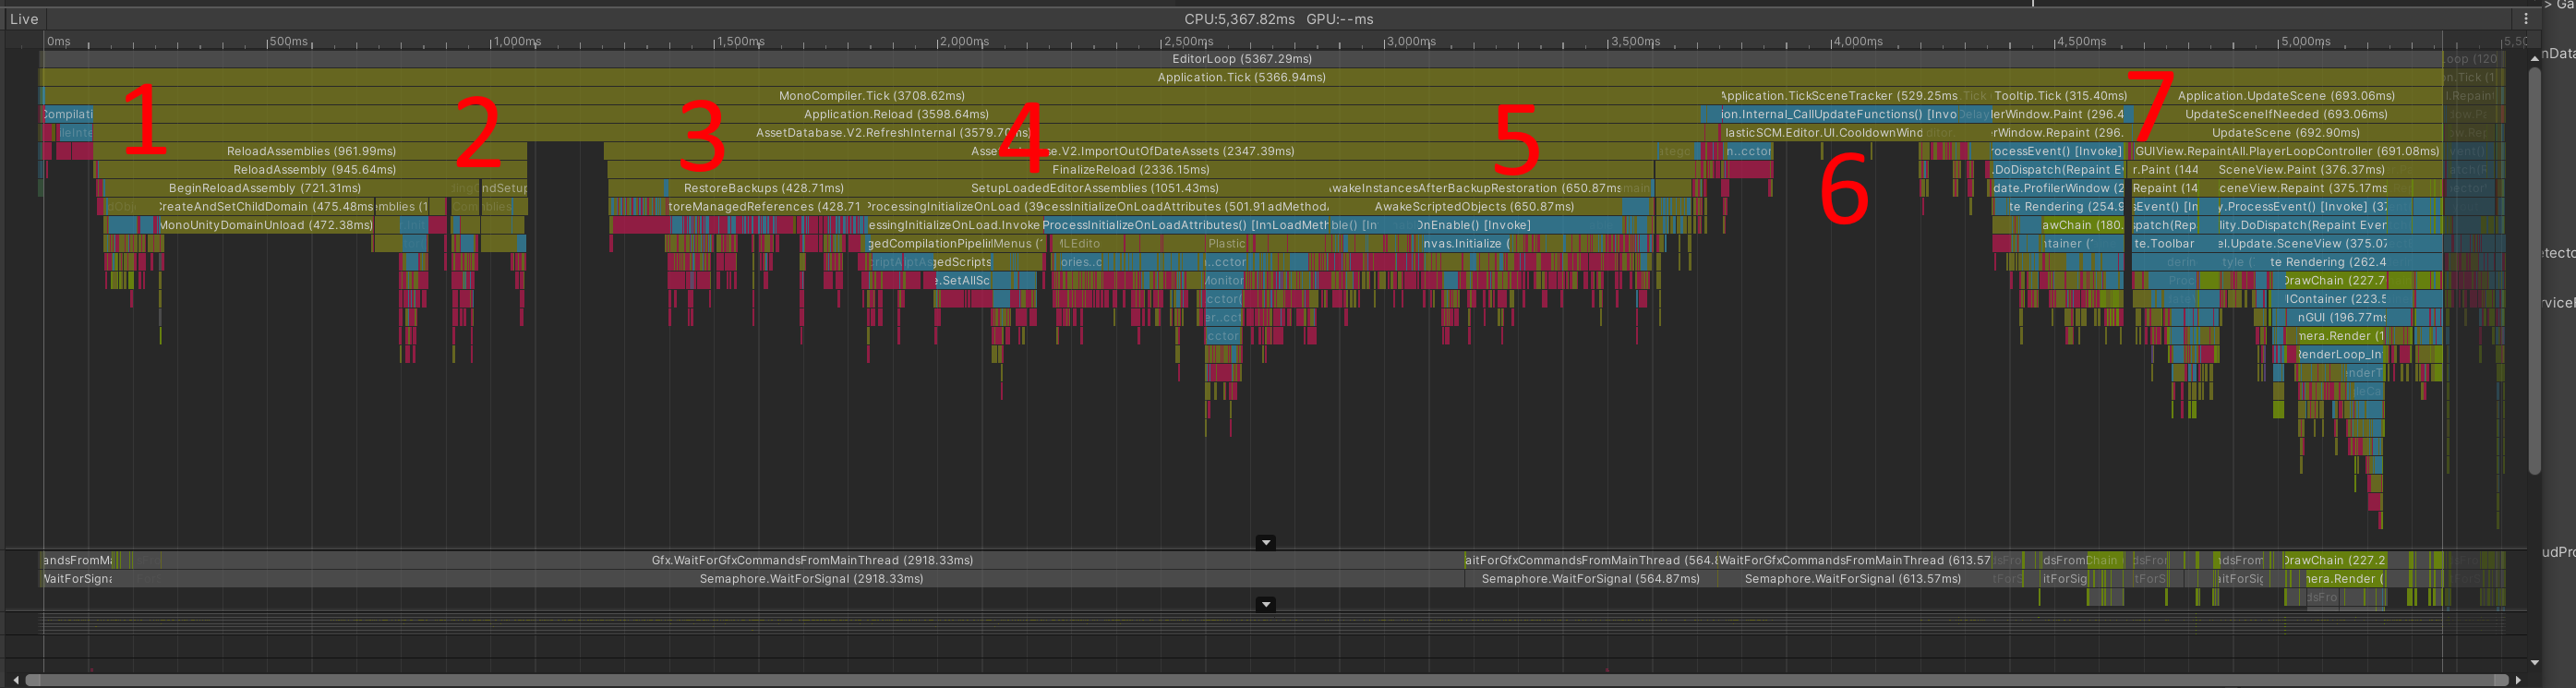
- The first marker of note is
BeginReloadAssembly. Below that you can findDisableScriptableObjects, followed byBackupScriptedObjects(that’s the serialization part). Then there isCreateAndSetChildDomainwhich is essentially just deallocating memory; Mono is particularly slow about this. This takes longer the more memory your managed code used in all its ways. - The rest of
ReloadAssemblyloads the new code and does a first round of initialization. - The next big event is
RestoreBackups. This is doing all the deserialization of data and as mentioned above can take a long time. SetupLoadedEditorAssembliesis where all the initialize on load callbacks happen. You’ll likely find your code and other code here.AwakeInstancesAfterBackupRestorationcallsAwakeon editor objects. After that, you can find more calls to callbacks.Application.TickSceneTrackersometimes callbacks that where put intoEditorApplication.update, usually to delay some initialization.- Later, a usual editor frame is rendered. This can be slower the first time after a domain reloading due to jitting and similar one-off initialization events.
A profiler capture of entering playmode
For entering playmode, this is a possible picture:
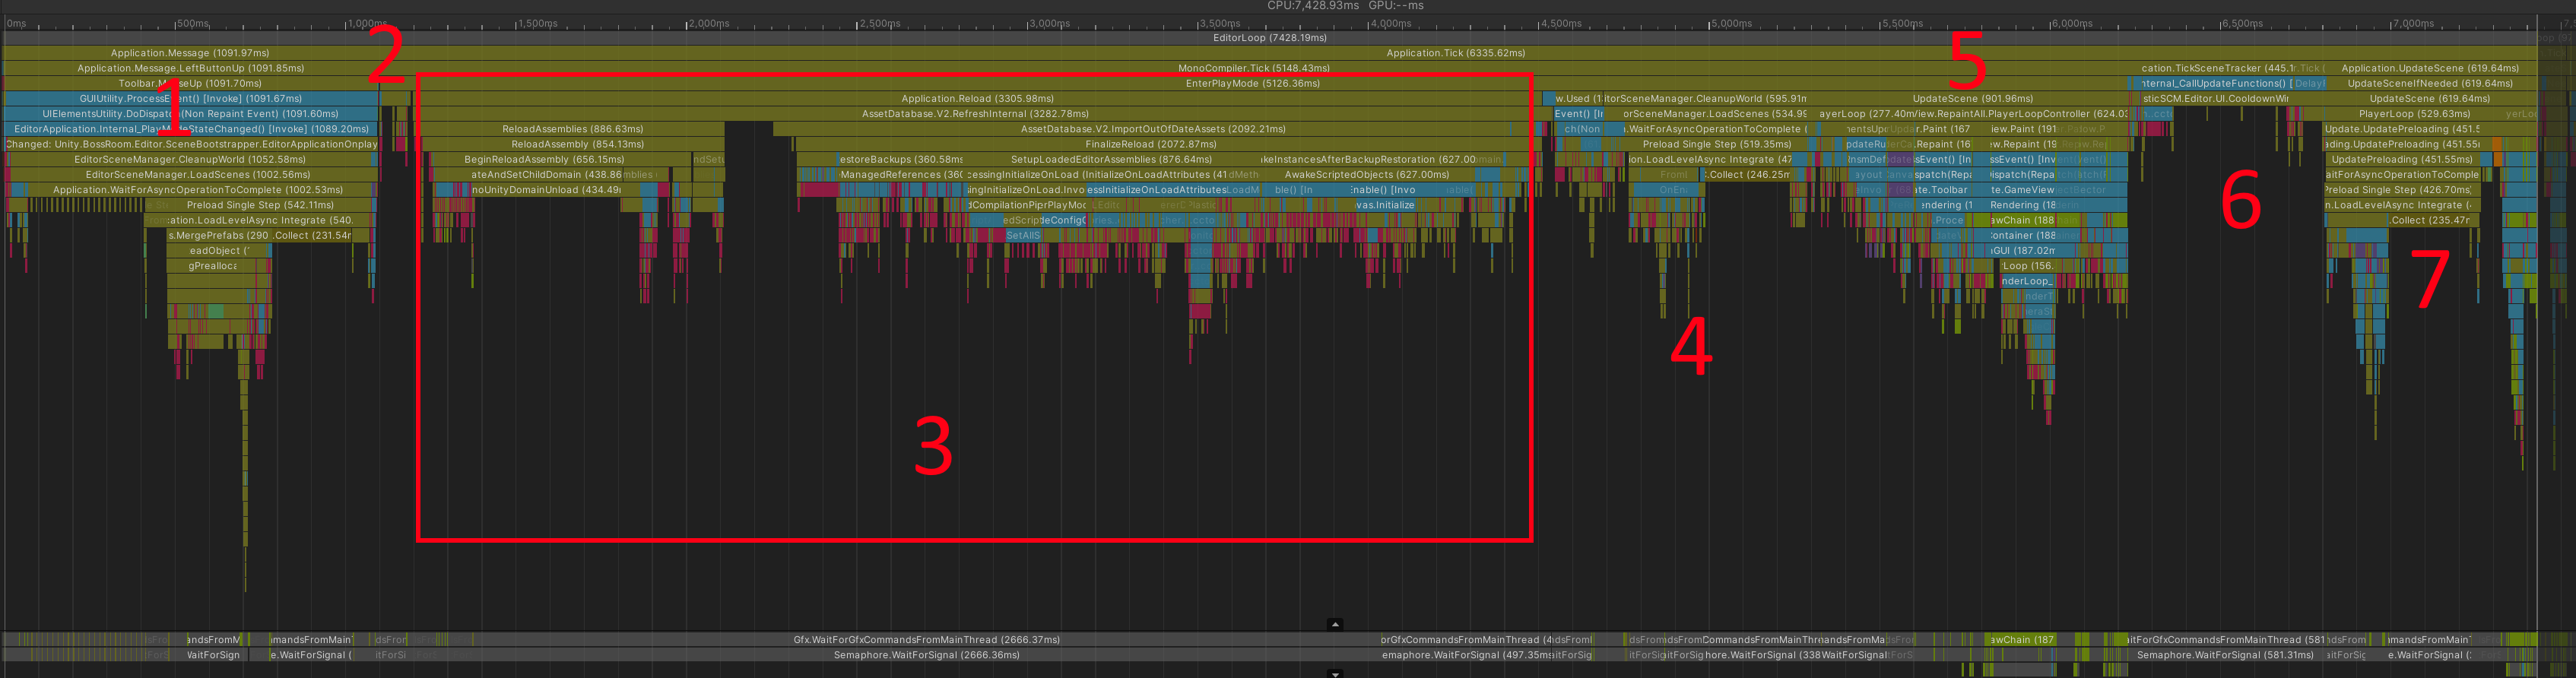
- This particular sample reacts to some event on changing playmode and decided to do some additional scene loading. It’s just an example of how anything in the project can cost you seconds.
- The second step is the scene backup and reload before the domain reload.
- That’s the domain reload, and in this step it takes up the lion’s share of the time. Larger scenes will likely spent more time in later parts of the process.
- This is where your scene is actually loaded and all of your
Awake/OnEnablecalls happen. - This is where the editor is rendering.
- These are the same
Application.TickSceneTrackercallbacks as above. - This is where the game loop is running for the first time.
Besides this first long frame, it also frequently makes sense to look at the next frame where often plenty of work is still happening. All of these steps really depend on the specifics of your game, but steps 4 to 7 in particular usually execute all of your game’s startup logic.
A note on progress bars
This doesn’t fit anywhere else, but I feel compelled to write about it. Unity has this popup progress bar that everybody dreads. There are essentially two reasons for why you can see this progress bar:
- Somebody may have decided to explicitly show you a progress bar because they anticipated that something is going to be slow. This is the good case.
- The editor detected that the main thread has been unresponsive for some time. Let’s call this “an editor stall.” The precise time threshold is configurable in the preferences: Look for
Busy Progress Delayin theGeneralsection – the documentation doesn’t seem to mention it. When the editor is unresponsive, the title of the progress bar will sayHold on...and the text in the progress bar will be an informed guess as to where the editor is currently spending time. This guess may or may not be helpful. In some cases the guess may include the name of an assembly that contains the offending code that is slowing down the editor, so you at least know who to poke or which asset store item to remove. Needless to say, it’s super bad when you see this stall progress bar, because it means that something is slow and nobody anticipated that it could be slow. Depending on your tastes, you can bump the delay up to some ridiculous numbers to no longer see progress bars for stalls.
Fun fact: There is one case where Unity shows a progress bar with the title Hold on... but it’s not a stall! Someone actually explicitly set the title to Hold on... for their progress bar, probably because they were so used to seeing that.