CompileScore is a wonderful tool for profiling compile times. I have used it a bunch in the past and wanted to document how to use this tool. I hope to draw attention to the fact that this tool exists and that you should be using it.
I am using CompileScore with Visual Studio on Windows, and you can find the extension here. As of writing, the most recent version is 1.8.4.
Recording a first trace
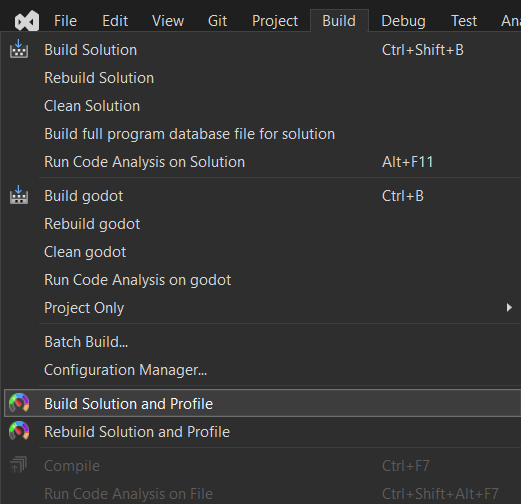
In my experience, the Visual Studio extension just works without any additional steps. I have tried it with Unity’s internal codebase and am using Godot’s codebase for this example. In both cases, the tool just worked. Once you have installed the extension and opened up your Visual Studio solution, go to Build and select Build Solution and Profile. This will trigger a build and collect data. Note that you may want to use the rebuild option to look at the total compile time. There are also other ways to collect data that are helpful for when you want to profile data on build machines, see the documentation for more information.
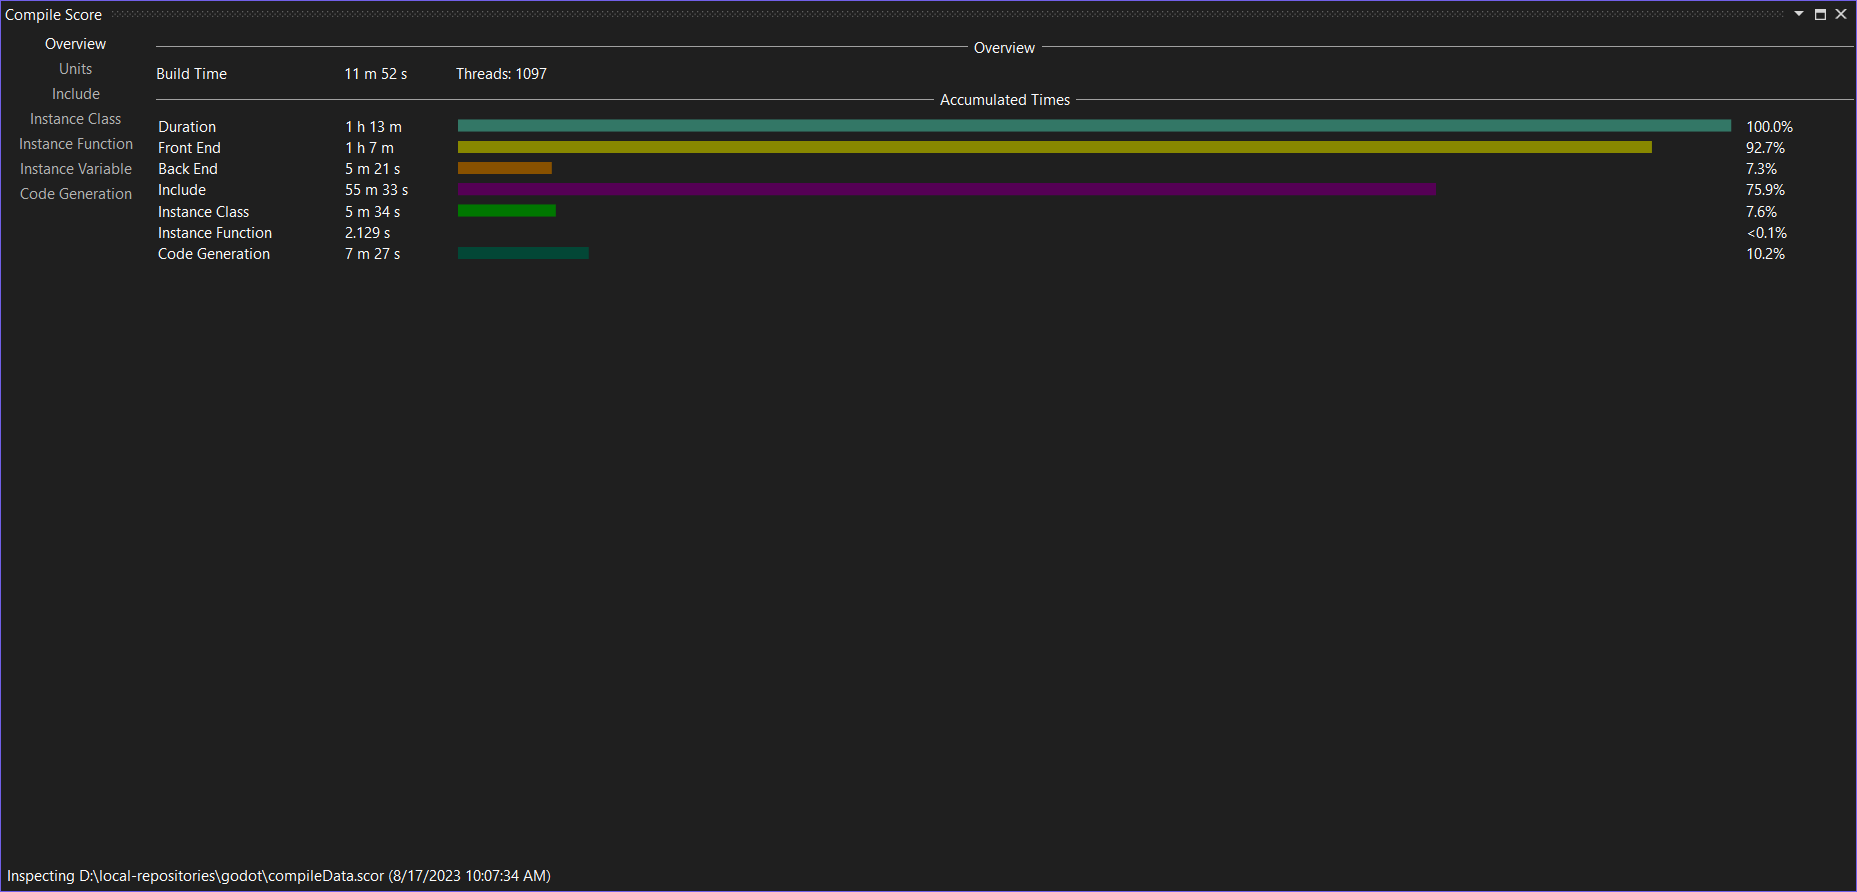
Once the compilation is done, the CompileScore window will open up and show the overview tab. You can open this window again later from the Extensions/CompileScore menu, and there also is a standalone version.
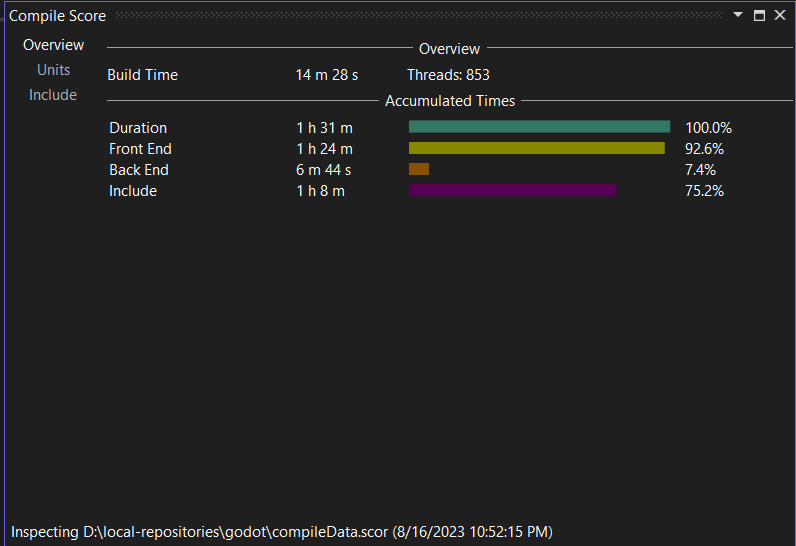
In this case, you can see that the total build time for Godot on my (10 year old) machine is 14m28s. That’s the wall time of the build. Below that, you can see that the actual CPU time was around 1h31m, which reflects the fact that my machine has 8 cores and Godot’s build system makes good use of them. Most of the time is spent in the compiler’s frontend. The frontend is where all of the parsing happens. Only a small fraction of the time is going into the compiler’s backend, which is responsible for code-generation. In my experience, this is not unusual: It’s not immediately clear to me how to parallelize parsing a single file, for example, and compilers generally reparse the same code many many times whereas code is not usually generated repeatedly (…with exceptions, of course). 75% of the total time went into parsing includes. This is a lot, and it’s a bit bonkers when you think about it, but it’s very much the common case – that’s why precompiled headers are a thing. Unless you actively put in an effort to clean up includes regularly, include times will be high. The include time is part of the total frontend time.
Next, let’s look at the Units tab that you can select on the left of the window:
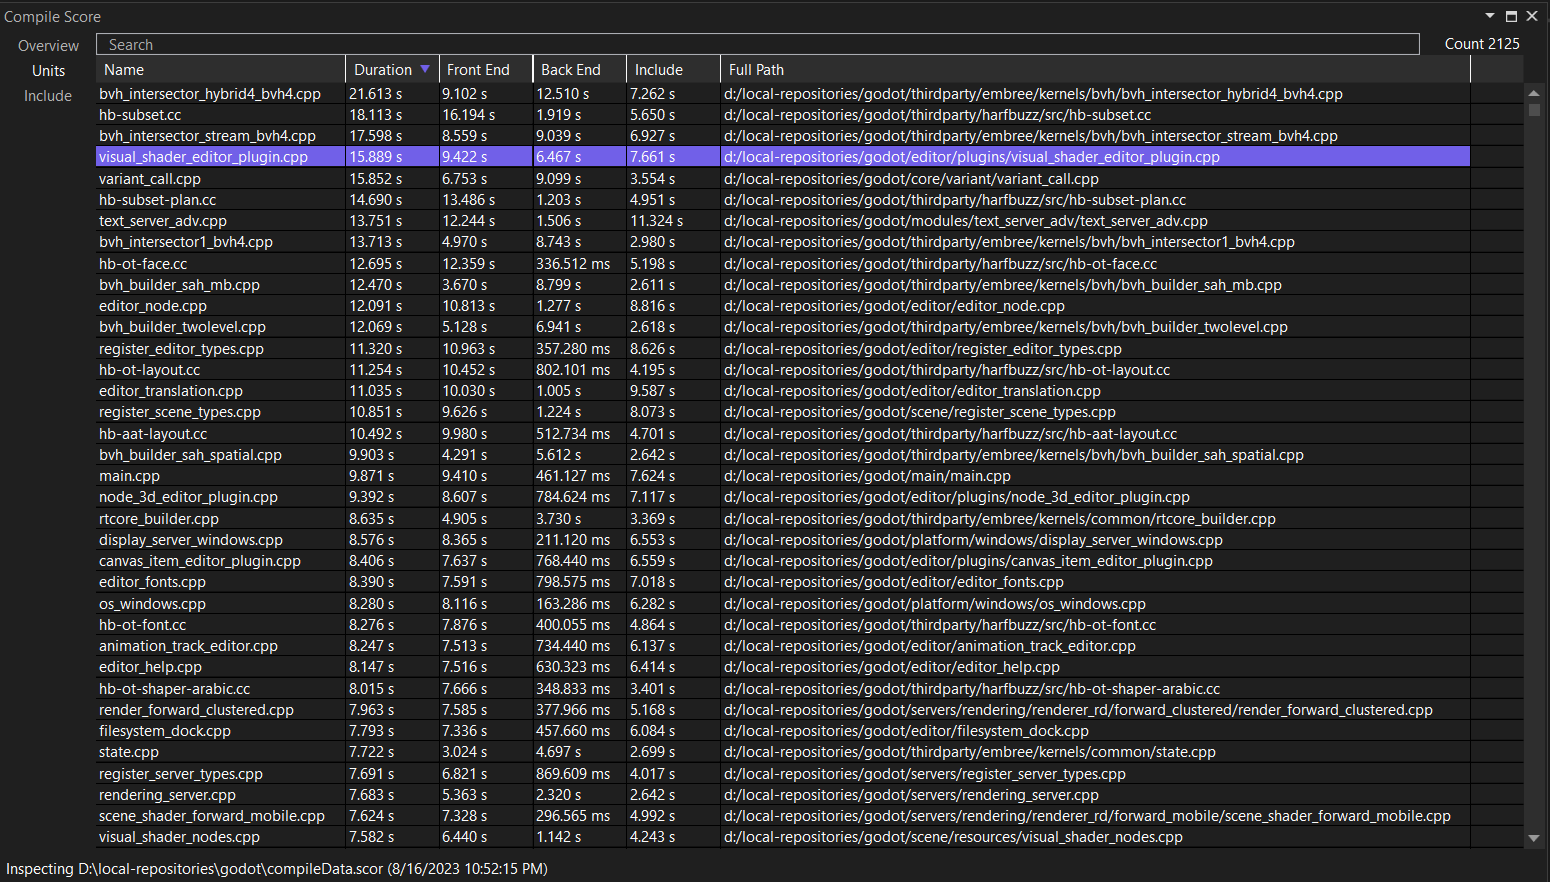
This tab shows the time taken per compilation unit. You can sort by columns. I would suggest starting by sorting by Duration first. You can right-click the entries in the table to open the respective file, and you can double-click it to bring up the timeline view.
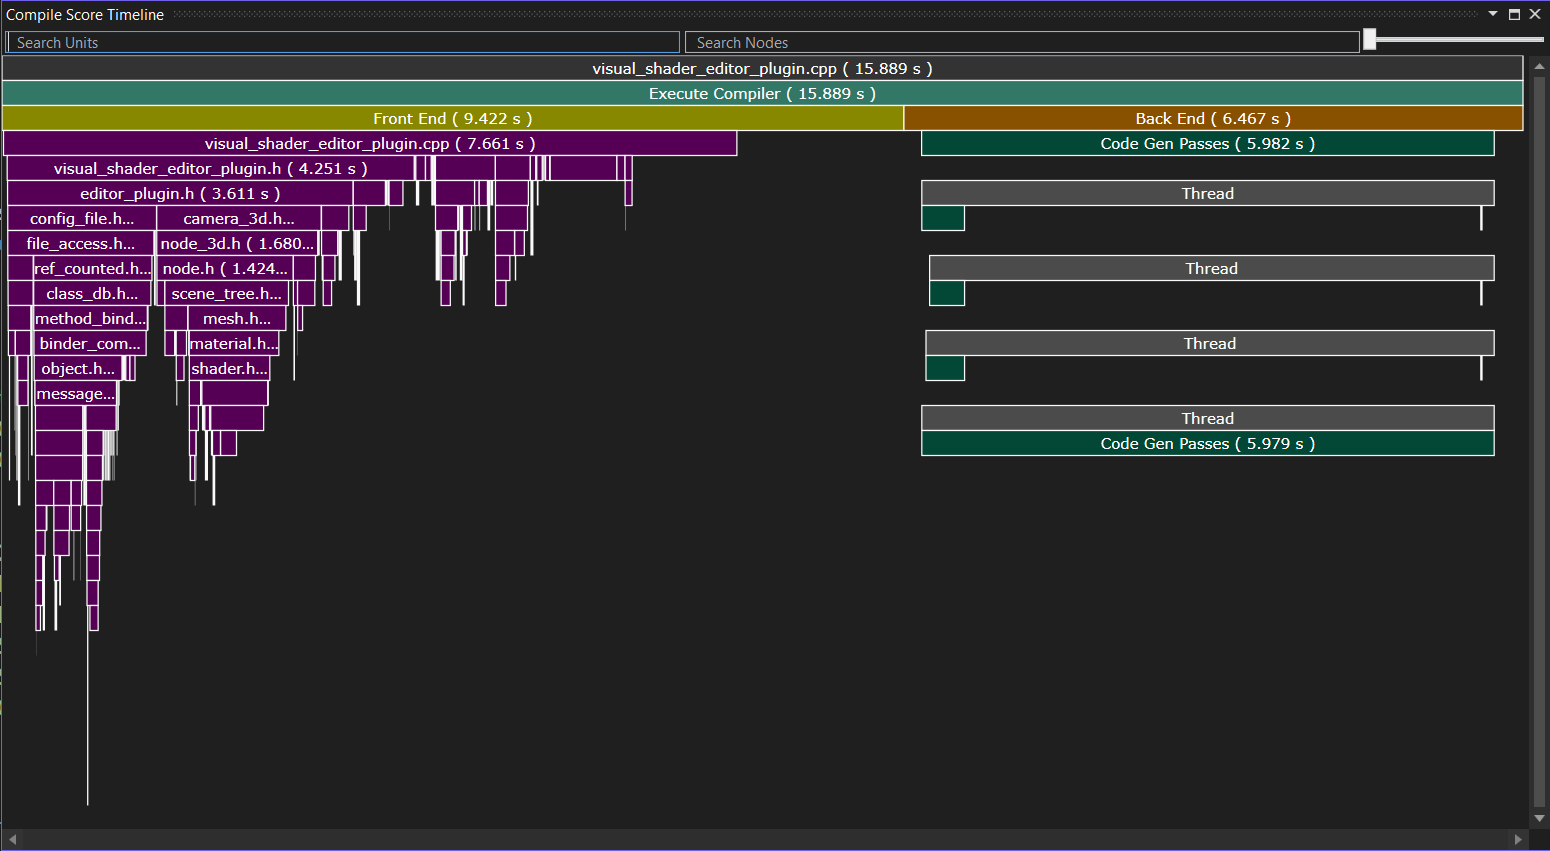
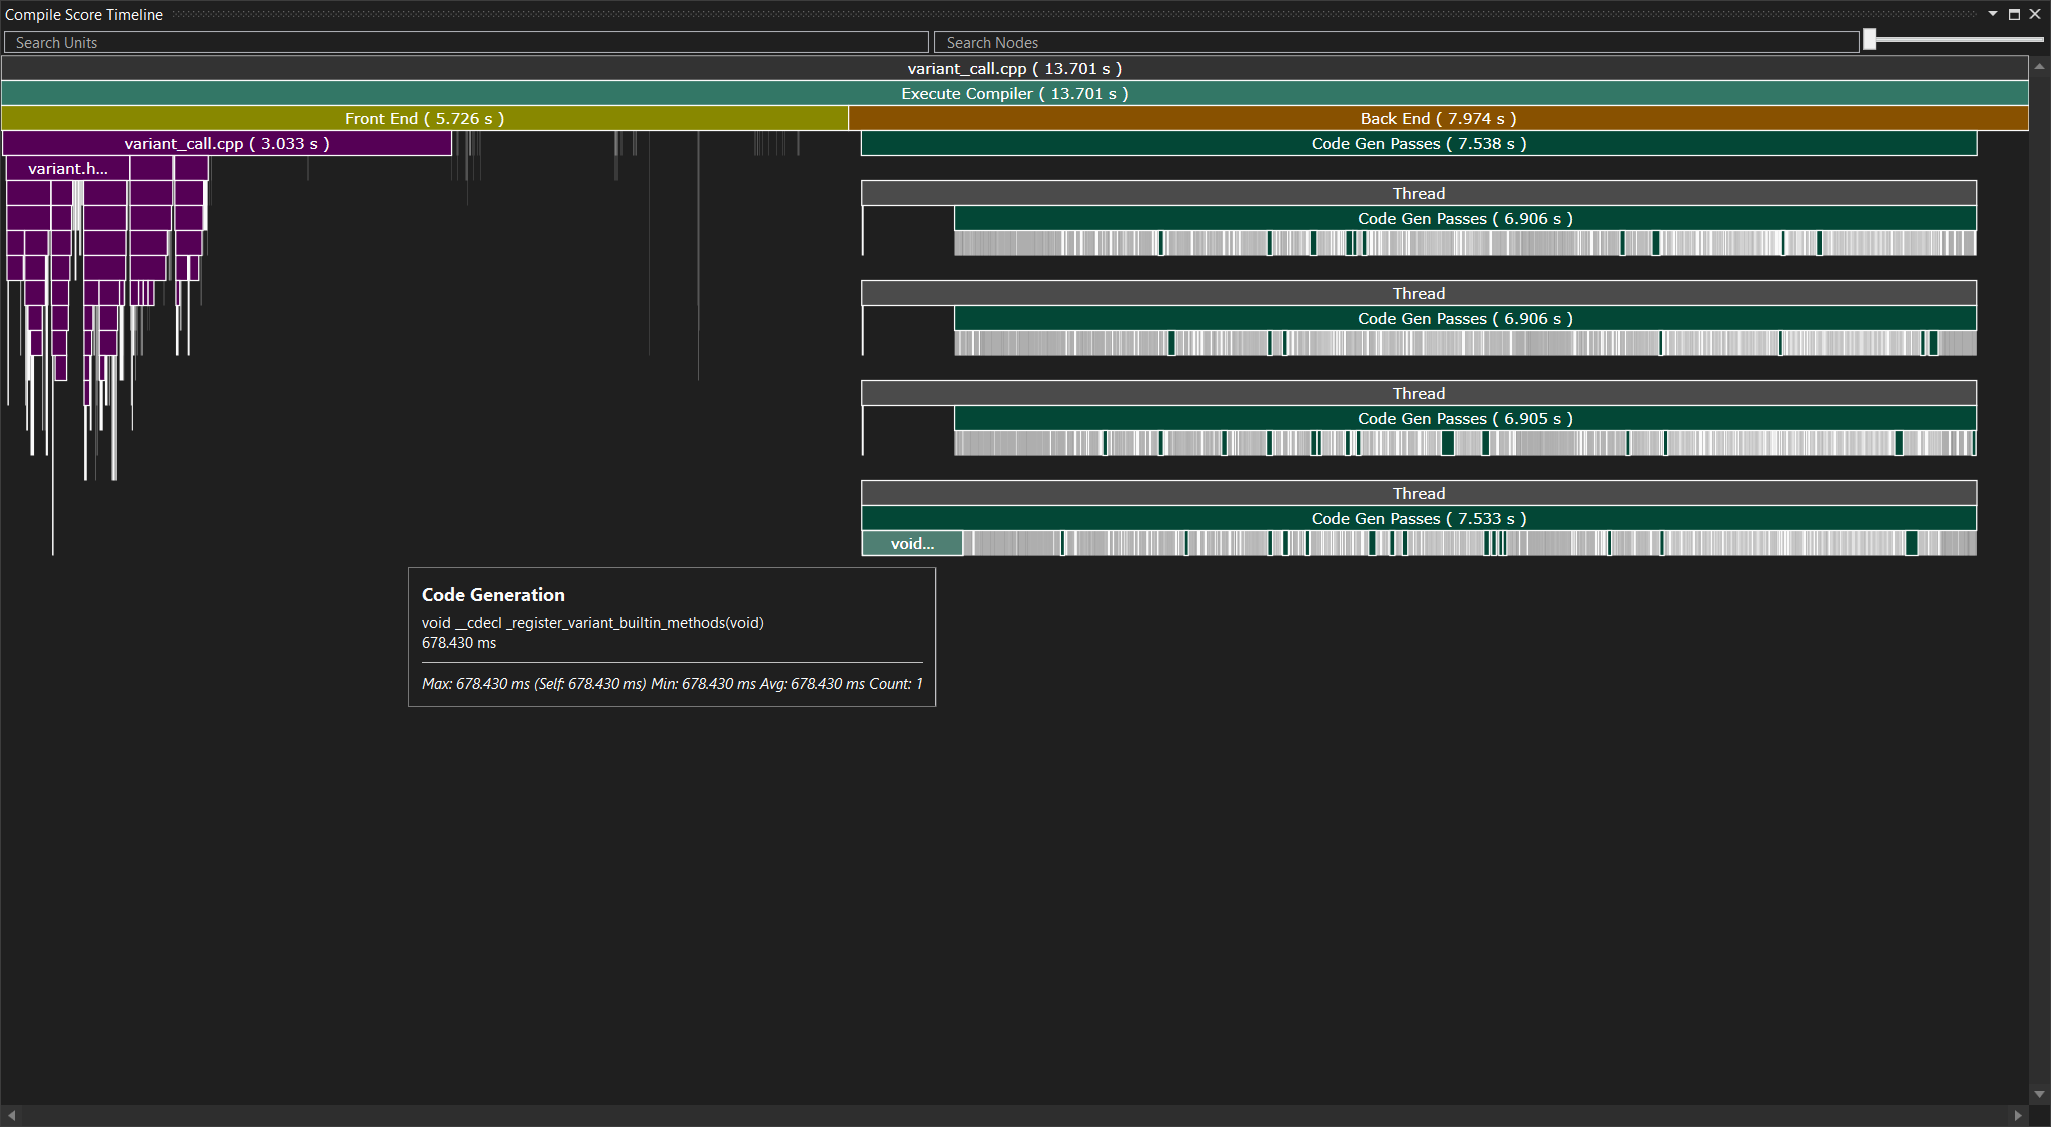
The timeline view shows you the entire timeline of processing this compilation unit, neatly divided into frontend and backend. The frontend part shows the included files in violet. Right-clicking any allows you to go to the “includer graph”, which we will look at soon. The timeline view is interesting if you have a single file that takes a long time to compile and need to understand why. You can get even more information for that and I have a note on this further down. In my experience however, you can usually find better wins by studying includes: We already know that the majority of the time goes into parsing and processing, and every include increases what you need to reparse tremendously, so reducing the amounts of includes is the actual goal for now. The compilation unit timeline then only is a qualitative view on a single file that you can use to learn about expensive includes.
So let’s look at includes next:
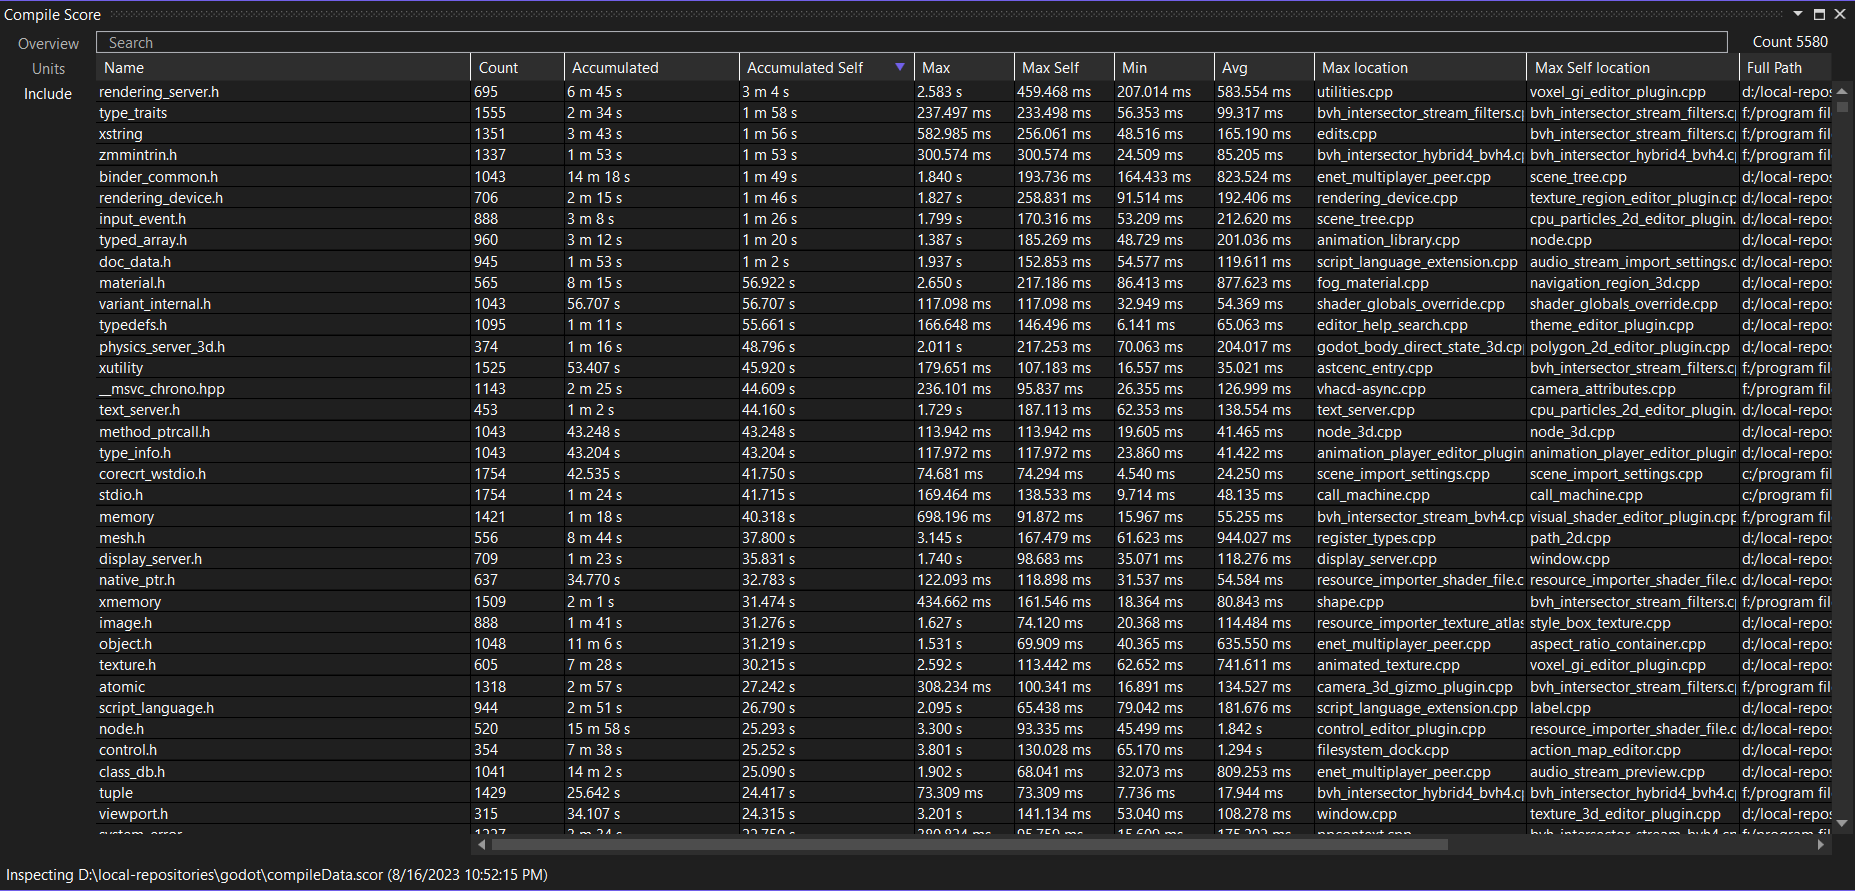
This table tells you which file is included how often and how long that takes. All of this is included in the frontend time. I would suggest sorting by Accumulated or Accumulated Self. These two numbers are commonly referred to as inclusive time and exclusive time in other profiling tools. The Accumulated time (inclusive time) tells you how long it took to include this header including all of the other headers that it includes itself. In other words, this is the total time it takes to include this header in practice across your entire codebase. The Accumulated Self time (exclusive time) tells you how long it took to include this header, subtracting all the time spent in headers that this header includes. This is the cost of the code in just this header, without any of the things it includes. As an example, a header that itself includes many other headers but doesn’t contain much code will likely have a high Accumulated time, but a low Accumulated Self time. If the exclusive time spent in a header is high, it probably contains a lot of code that needs to be parsed and processed. The likely culprits are templates and their implementations, as they need to live in header files, heavy macro use, and meta programming.
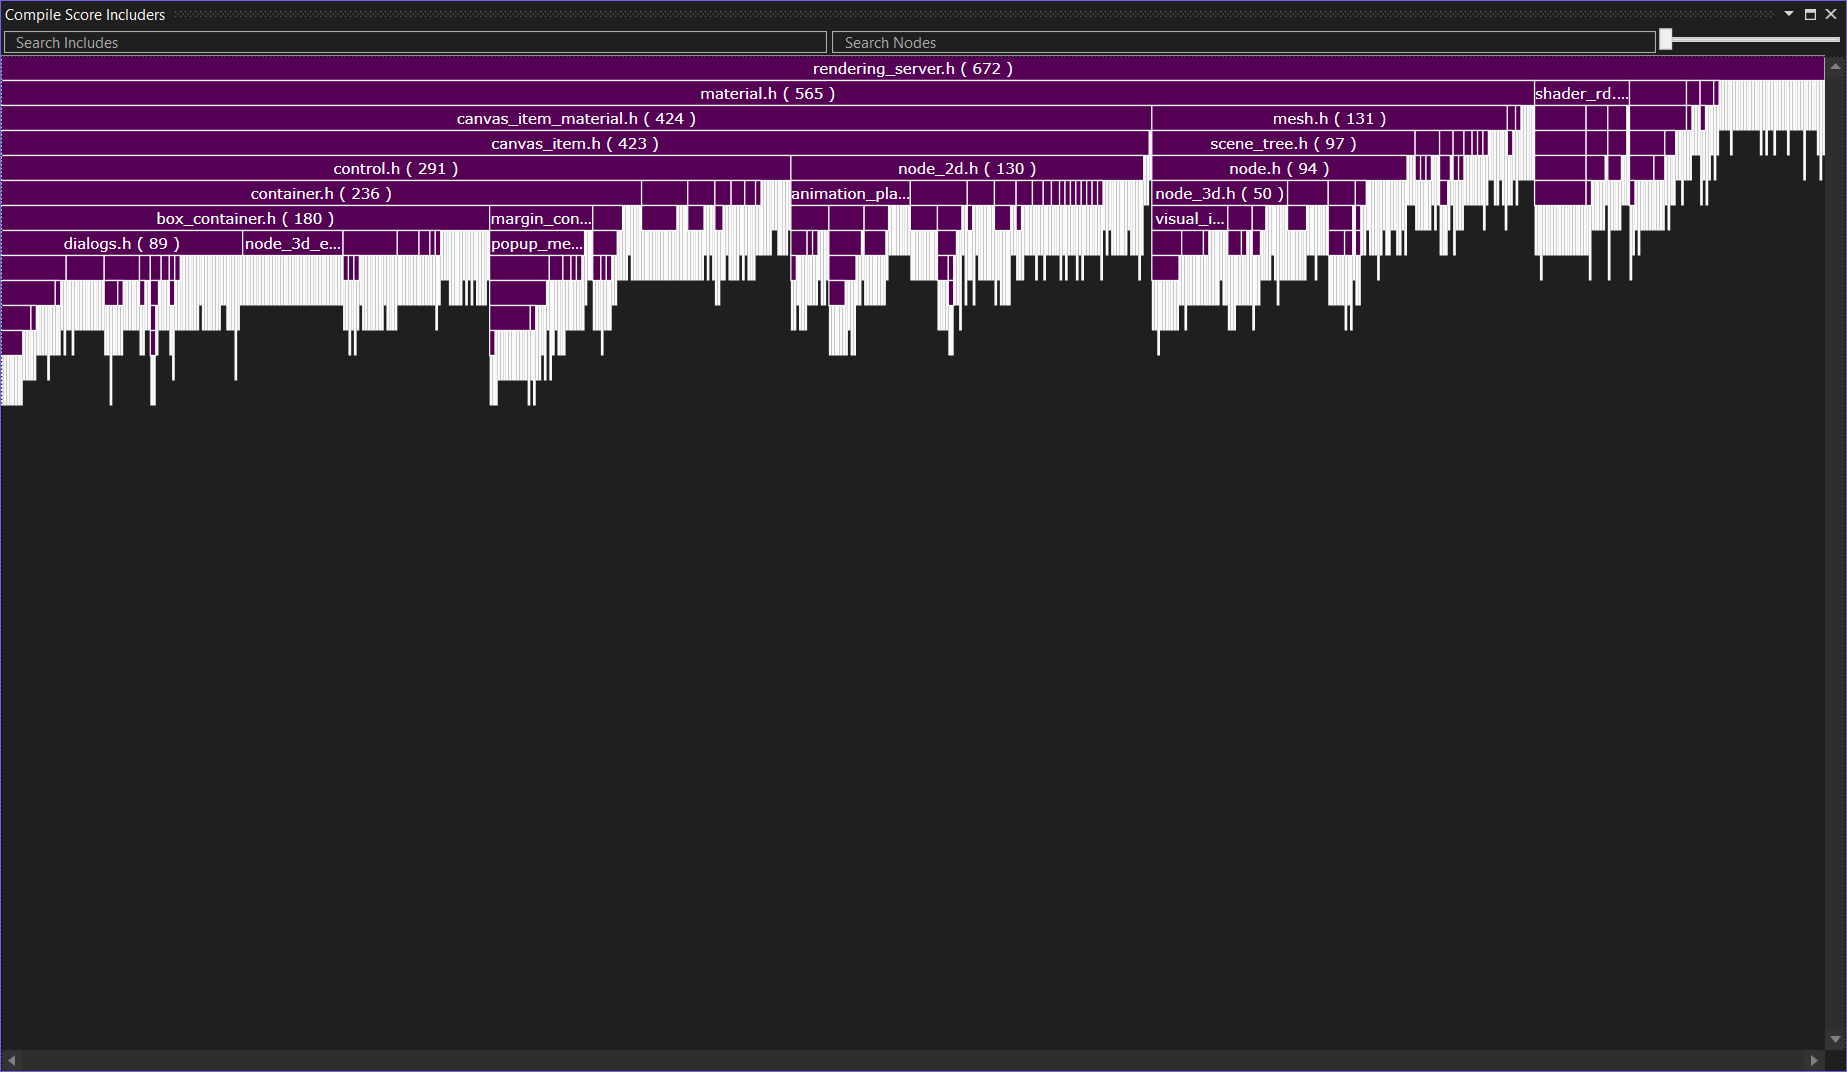
In the table, you can also see in which files a header took a long time to include. Double-click a row to open the timeline view for the most expensive include site. When you right-click a row, you can also choose to open up the includer graph. This is probably the most important view of all:
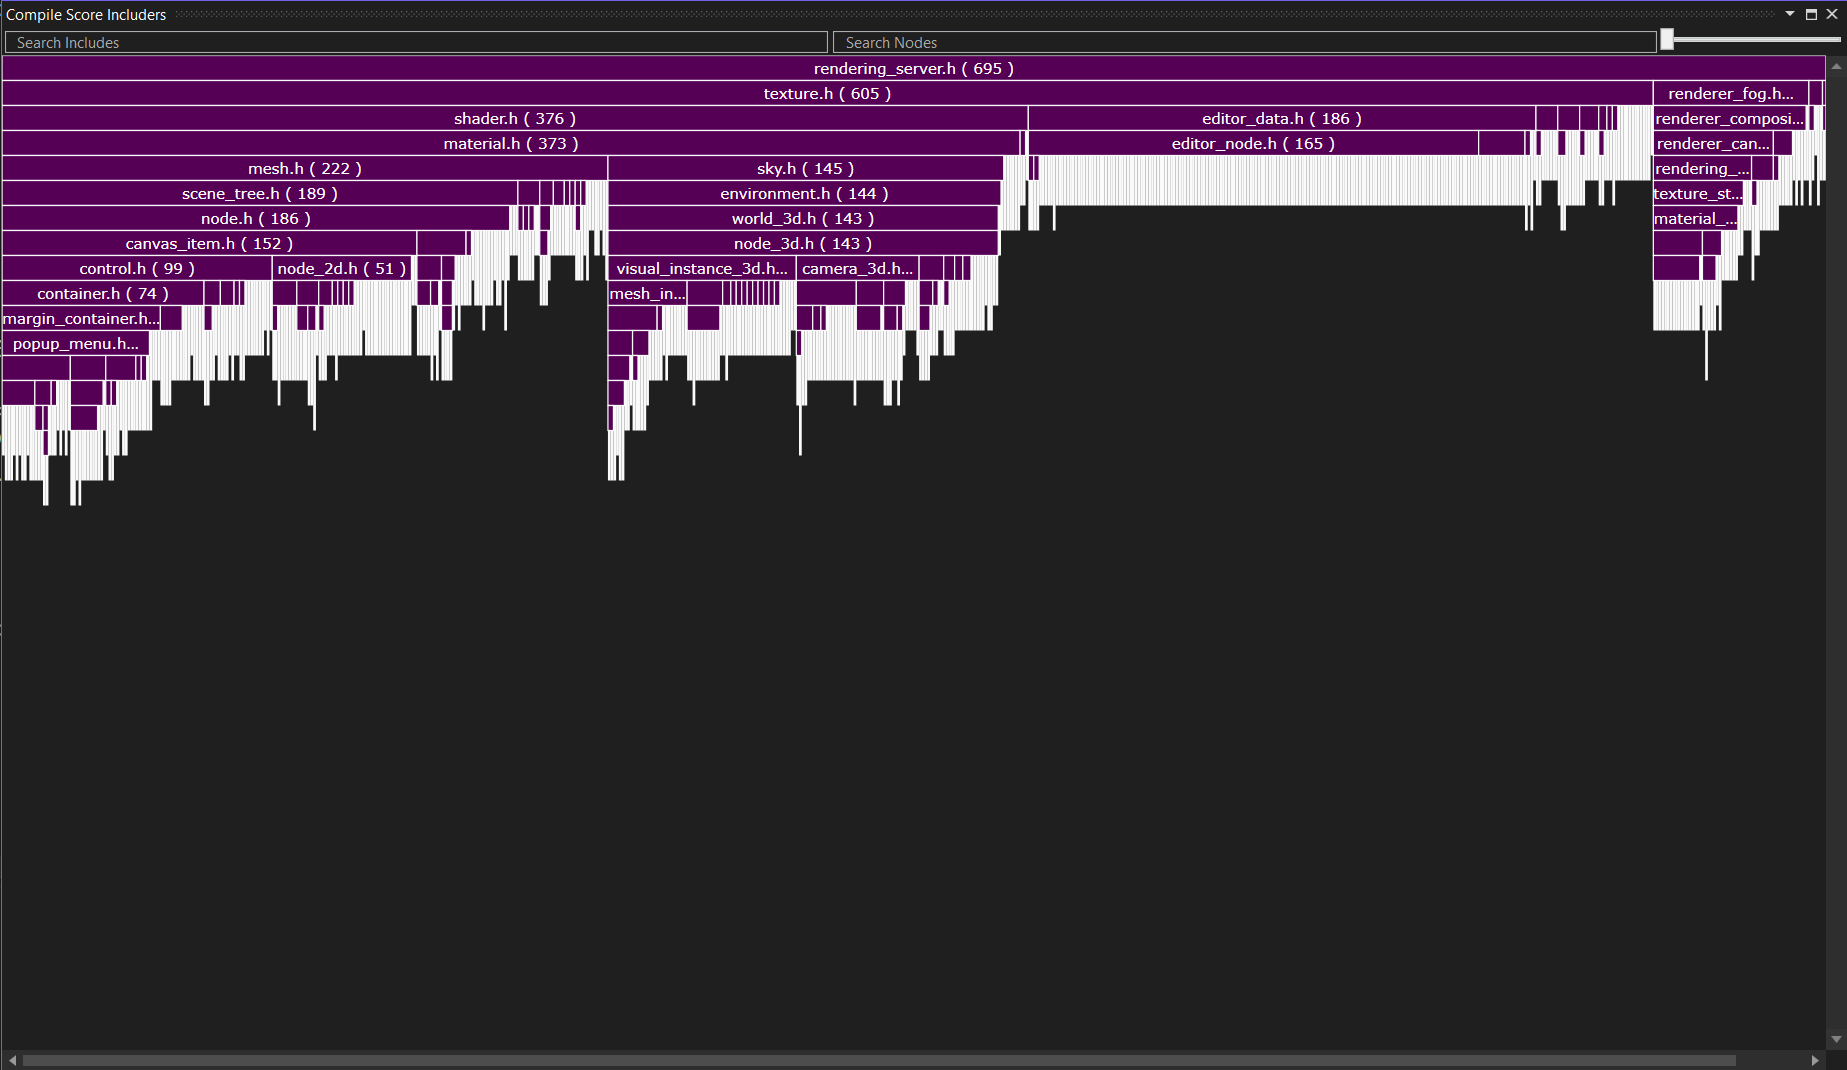
The includers graph shows you for a given header which other files include it. In the example above, I have opened the includer graph for rendering_server.h. It is included a grand-total of 695 times. You can see below that most of the time it is included in a file because that file included texture.h.
How to actually use this
Now that we have seen the different windows, I can outline a broad strategy for reducing compile times. As we have seen before, the most common problem is that the compiler spends time on processing includes. This is what we should focus on. There are two options for reducing this number: Make headers contain less code or include fewer headers. We will focus on including fewer headers.
First, go to the include list and look for an most expensive header as sorted by Accumulated. In our example, I picked rendering_server.h. This header is expensive. Let’s double-click to open the include site where it took the longest to get a qualitative sense for why it is expensive:
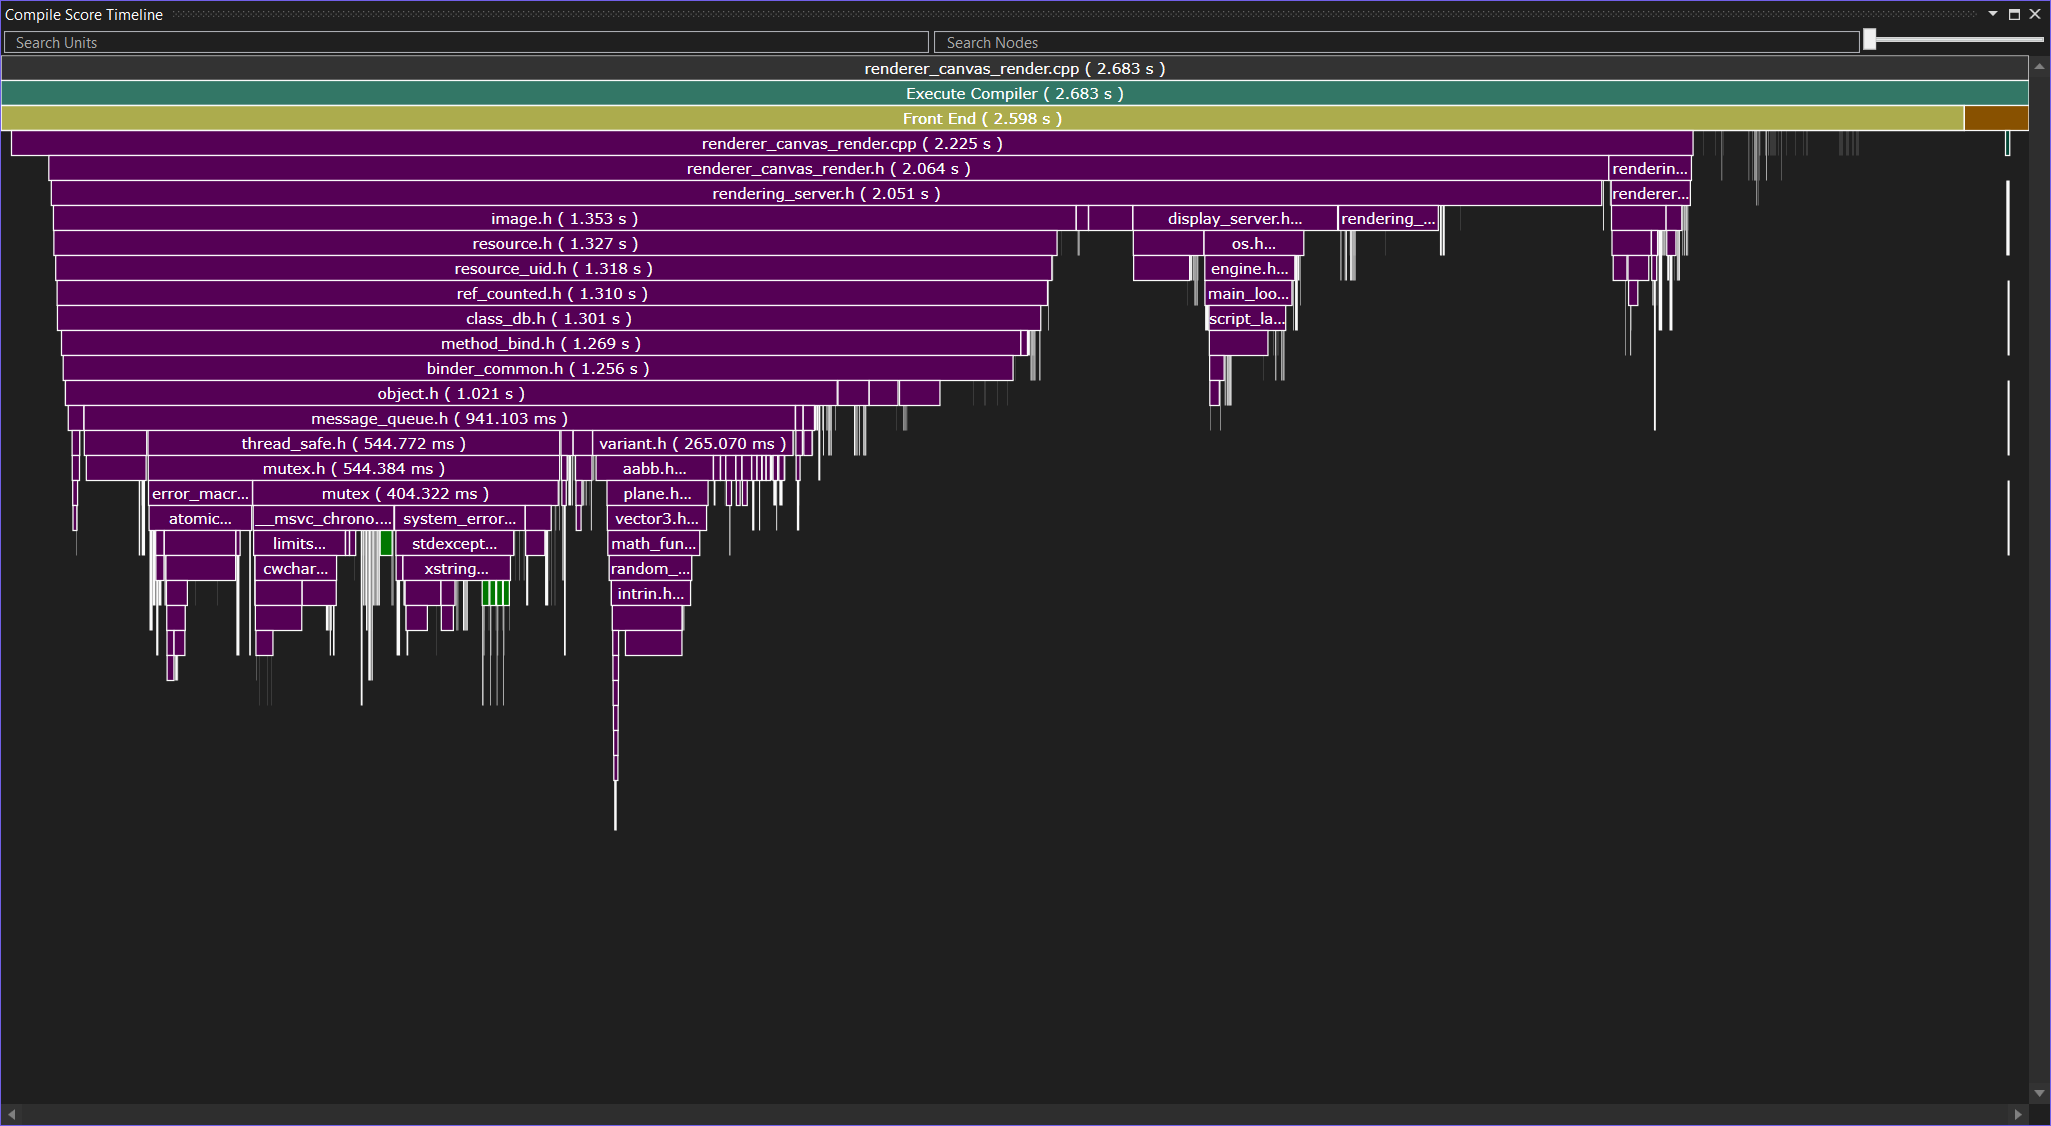
Aha, it seems to mainly be expensive because it includes the image.h header, which through an unfortunate sequence of events pulls in other expensive headers like mutex.h. As you can see, including a wrong header in a single place can trigger a cascading set of additional includes. At this point, we essentially have two choices for including fewer headers: Try to reduce the number of includes in rendering_server.h, or try to reduce the number of times that rendering_server.h is included. If you look at the code, it doesn’t look easy to get rid of the image.h include in rendering_server.h. However, recall from the our look at the includer graph above that texture.h is the main reason why compilation units contain rendering_server.h in the first place. I don’t know much about Godot at all (I have never looked at the code before, in fact, and have never used it), but I do know what a texture is, I do know what a server is, and it does sound vaguely reasonable to me to assume that texture.h need not include rendering_server.h – regardless of what a “rendering server” is.
Removing rendering_server.h from texture.h does indeed work. When you recompile, you get a bunch of errors from various texture implementations that they now cannot find the rendering server, but that is easily fixed by adding the rendering_server.h include to those *.cpp files. The general goal of this entire exercise is to move includes from header files to the compilation units themselves: Includes in header files easily sprawl and make compile-times explode, include in .cpp files don’t (because nobody will include the .cpp file, usually).
Now let’s check the new compilation results:
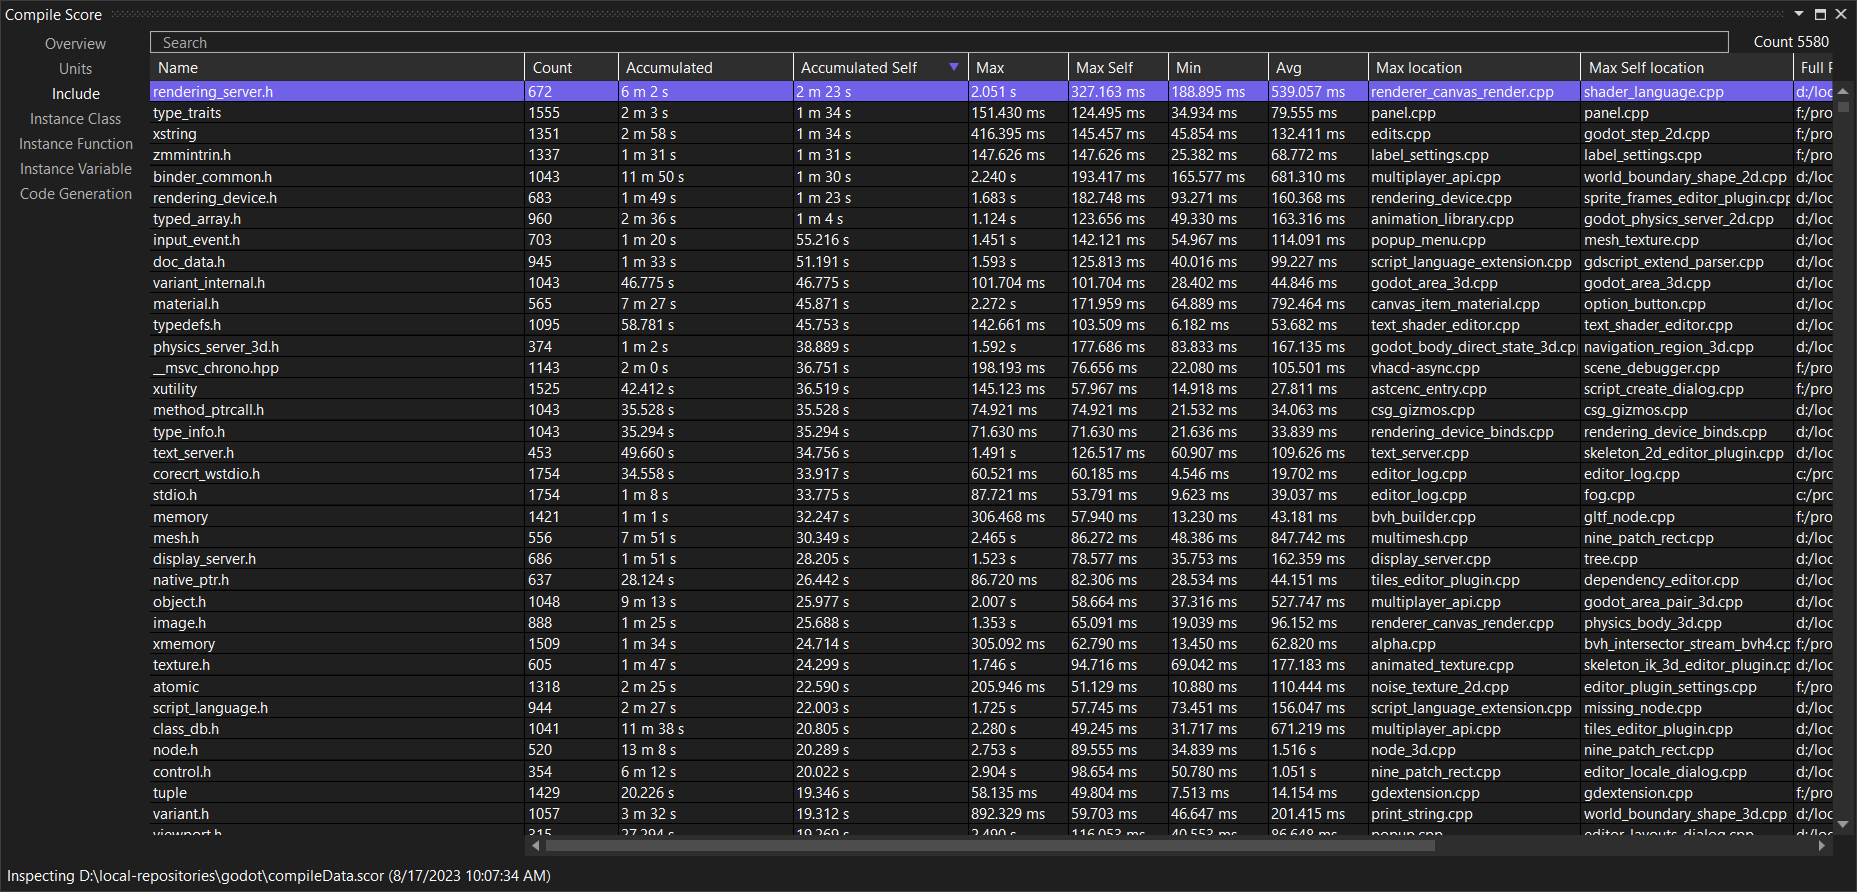
As you can see, we made a small dent, though it could also just be noise. I have only measured once. At a first glance, I think this result should be surprising: We eliminated a pretty central include, and the time for that header went from 6m45 to 6m2s. Why didn’t our changes do more? Again, the includer graph view is your friend:
It turns out that most places that ended up with rendering_server.h via texture.h actually got texture.h via material.h, and that one also includes rendering_server.h. This highlights a pitfall here: During a compilation, we can arrive at the same header via many different paths. That’s why include guards exist in the first place. When we look at include times, we are always just observing the first path, because that is the expensive one (others just early out). From skimming the files, it looks like you could make material.h mostly independent of the expensive parts of rendering_server.h with a little bit of massaging.
This example demonstrates the importance of measuring repeatedly and validating any improvements, and it also shows that getting includes back under control is hard. Imagine doing this in a codebase where people push new code every day. However, this doesn’t mean that the entire effort is futile: In other cases this same process will yield better results. For example, input_event.h is an expensive header that is mostly pulled in through main_loop.h. Removing this single include main_loop.h cuts the time spent on input_event.h by two thirds.
This might also be a good place to give a shout-out to Header Hero (the code there is down but Aras has a copy here). HeaderHero relies on parsing your project’s header files to help you cut down on unnecessary includes. Their blog post also lists some common techniques for reducing inter-header dependencies. There probably is space for a tool that takes different paths to headers into account somehow.
Additional options: template instantiation and codegen
Here, have this bit of bonus content that I felt should be included, but I don’t have an example to look at. CompileScore allows us to explore another aspect of C++ compilation: templates instantiation and code generation. You need to first tell CompileScore to collect some additional data. Go to Extensions/CompileScore/Solution Configuration. In the Generator section, you can find two options of interest: Overview Detail and Timeline Detail. Set them both to Full. The precise meaning of the different options is listed here. When you now rebuild your solution, you will find the resulting trace has additional data:
The new numbers are part of both the backend and frontend times. The color coding in the graph matches the color coding in the timeline view. The new times here are Instance class (which tells you how much time it took to instantiate class templates), Instance Functions (which does the same for functions), and code generation. There’s also a separate tab for Instance Variables. For all I can tell, all the template instantiation times are part of the frontend and the codegen time is the bulk of the backend. The reason why the codegen time exceeds the total backend time is because the backend time is aggregated CPU time across compilation processes, but each process itself can use multiple threads.
With this new information, the timeline view also contains more details, especially in the backend phase (but also the frontend phase, though that’s harder to see in this screenshot). You can now see which functions actually took time during codegen, for example.
The new views are largely self-explanatory. In my experience, the template instantiation views are (unsurprisingly) helpful when you are dealing with code that does a lot of compile time meta programming. That doesn’t seem to be the case with Godot, thankfully. I do recall using these views on Unity to reduce the compile times for some very expensive functions - it’s a good way to dig into the rare pathologically bad cases. But that might be for another time.